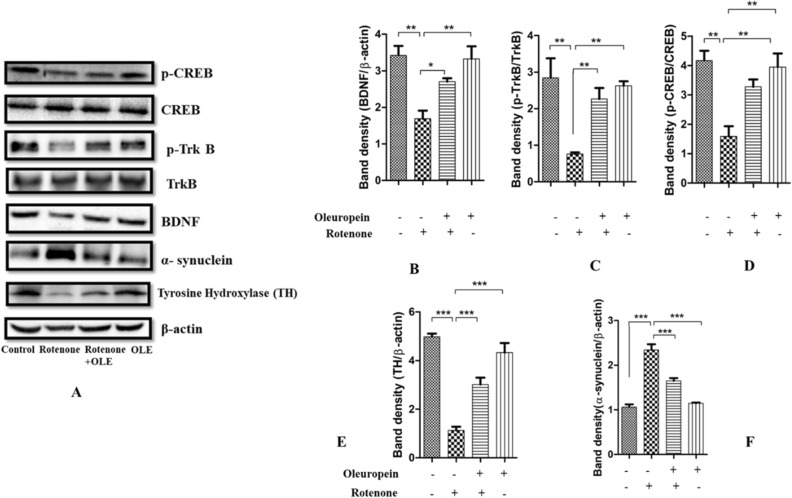
Figure 8.
(A–F) This figure shows the relative expression of α-synuclein, TH, p-Trk B, BDNF, p-CREB, in which β-actin acts as a control (A). The lower expression of BDNF (B), p-Trk B (C), CREB (D), TH (E) was observed in case of rotenone-intoxicated mice (***p < 0.001) (**p < 0.01) respectively. while OLE administered group showed significantly increased expression of TH, CREB, BDNF and p-Trk B and BDNF (***p < 0.001) (**p < 0.01) respectively. Aggregation of α-synuclein (F) was found to be more in rotenone group (***p < 0.001) than control whereas OLE-treated group showed lower aggregation of α-synuclein (***p < 0.001). The one-way ANOVA was used to analyse the data, followed by the Newman–Keuls test. The mean ± SEM (n = 6) is used to depict the values.

