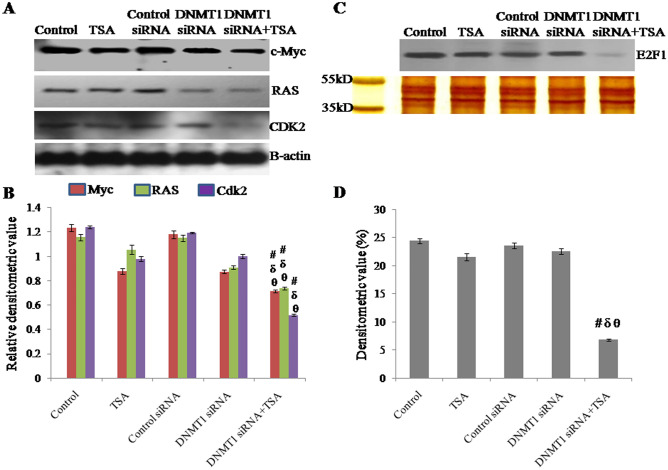
Figure 10.
Protein level (expression) of (A) c-Myc, RAS and CDK2 analyzed by Western analysis using β-actin as loading control, (B) relative densitometric value obtained from densitometric scanning after normalization with β-actin. The representative blots of replicates were presented here. The full-length original images (cropped) of representative blots were presented in the supplementary Fig. S9 of Supplementary information file. Activation and nuclear translocation of (C) E2F1 analyzed by Western analysis of nuclear protein, and SDS-PAGE and silver staining of whole nuclear extract (protein) showing protein integrity and equal loading, (D) Densitometric value obtained from densitometric scanning. The representative blot of replicates was presented here. The full-length original images (cropped) of representative blot and silver stained gel were presented in the supplementary Fig. S10. Data was represented as mean ± SEM., n = 3, p < 0.05. #, δ and θ represent; compared to control group, TSA treated group and DNMT1 siRNA transfected group respectively.

