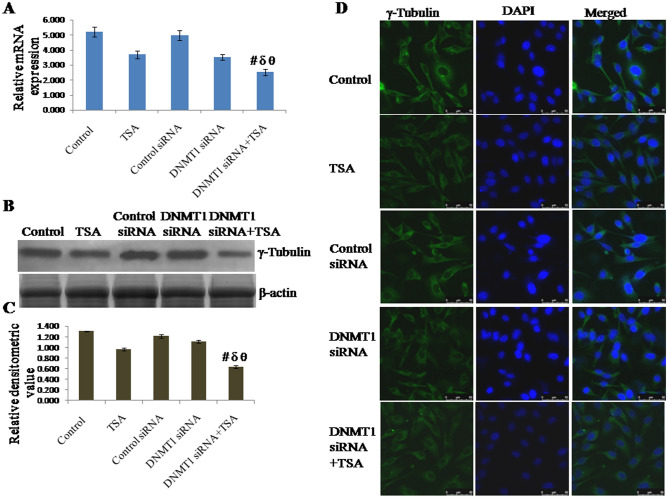
Figure 2.
Expression of γ-Tubulin analyzed by (A) qRT-PCR using GAPDH as internal control and expressed in terms of relative mRNA expression, (B, C) Western blotting using β-actin as internal control and expressed in terms of relative densitometric value, (D) immunofluorescent staining and confocal microscopy to observe cellular localization of γ-Tubulin. The representative blots of replicates were presented here. The full-length original images (cropped) of representative blots were presented in the supplementary Fig. S3 of Supplementary information file. Data was represented as mean ± SEM., n = 3, p < 0.05. #, δ and θ represent; compared to control group, TSA treated group and DNMT1 siRNA transfected group respectively.

