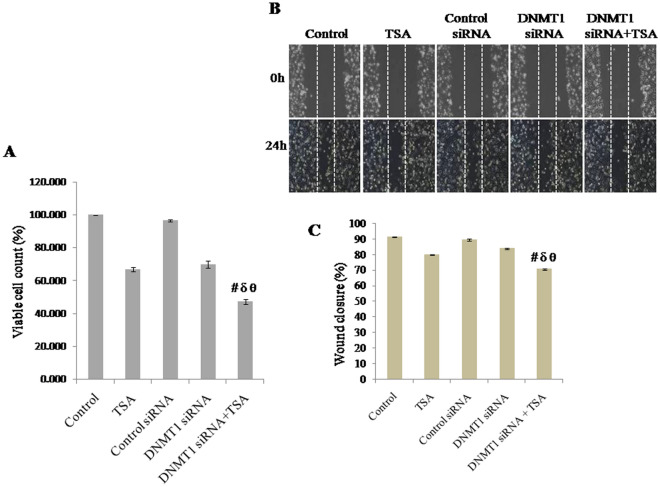
Figure 7.
Effect of knockdown of DNMT1 and inhibition of HDAC1 & HDAC2, combined or due to either of any one on (A) cell viability analyzed by MTT assay and determined in terms of percentage of viable cells present, (B, C) cell migration, determined in terms of percentage of wound closure. Data was represented as mean ± SEM., n = 3, p < 0.05. #, δ and θ represent; compared to control group, TSA treated group and DNMT1 siRNA transfected group respectively.

