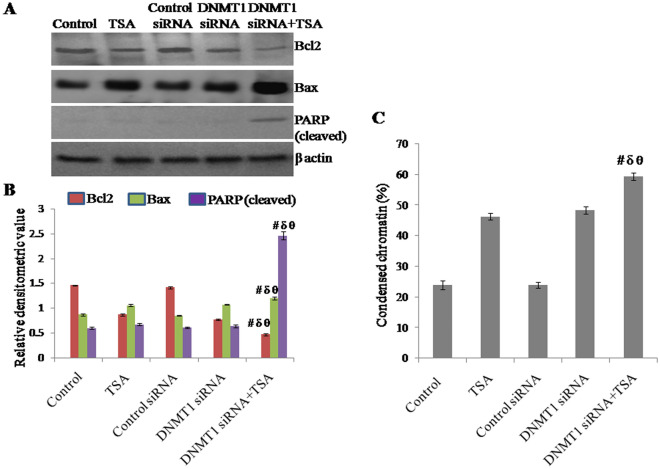
Figure 8.
Effect of knockdown of DNMT1 and inhibition of HDAC1 & HDAC2, synergistically or due to either of any one on apoptosis observed in terms of (A, B) Western blotting analysis of Bcl2, Bax and PARP (cleaved) using β-actin as loading control and expressed in terms of relative densitometric value, (C) percentage of condensed chromatin with respect to total chromatin. The representative blots of replicates were presented here. The full-length original images (cropped) of representative blots were presented in the supplementary Fig. S7 of Supplementary information file. Data was represented as mean ± SEM., n = 3, p < 0.05. #, δ and θ represent; compared to control group, TSA treated group and DNMT1 siRNA transfected group respectively.

