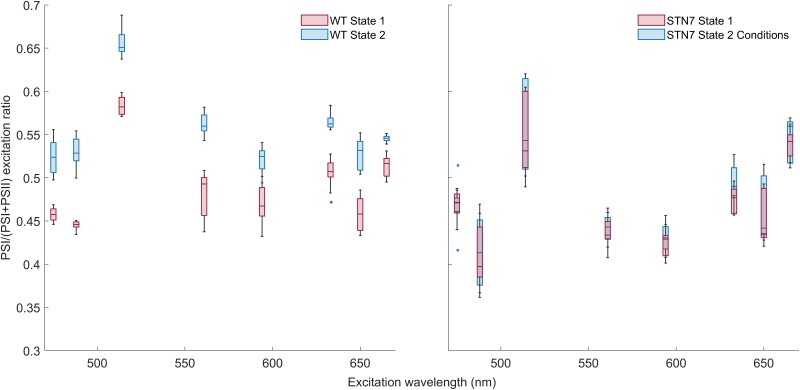
Figure 2.
PSI/(PSI + PSII) excitation ratio of WT and STN7 leaves of Arabidopsis measured using FLIM. The leaves were imaged in state 1 and state 2 at various excitation wavelengths. The measurements are displayed in a boxplot. The middle line gives the median of the data. The values inside the box represent 50% of the measured data, and the whiskers together with the box comprise 95% of the measured values; number of chloroplasts imaged per condition is 9. The circles that remain are the outliers. State 1 and state 2 are significantly different in WT at all measured excitation wavelengths with a P-value of the Student's t test of P < 0.001.

