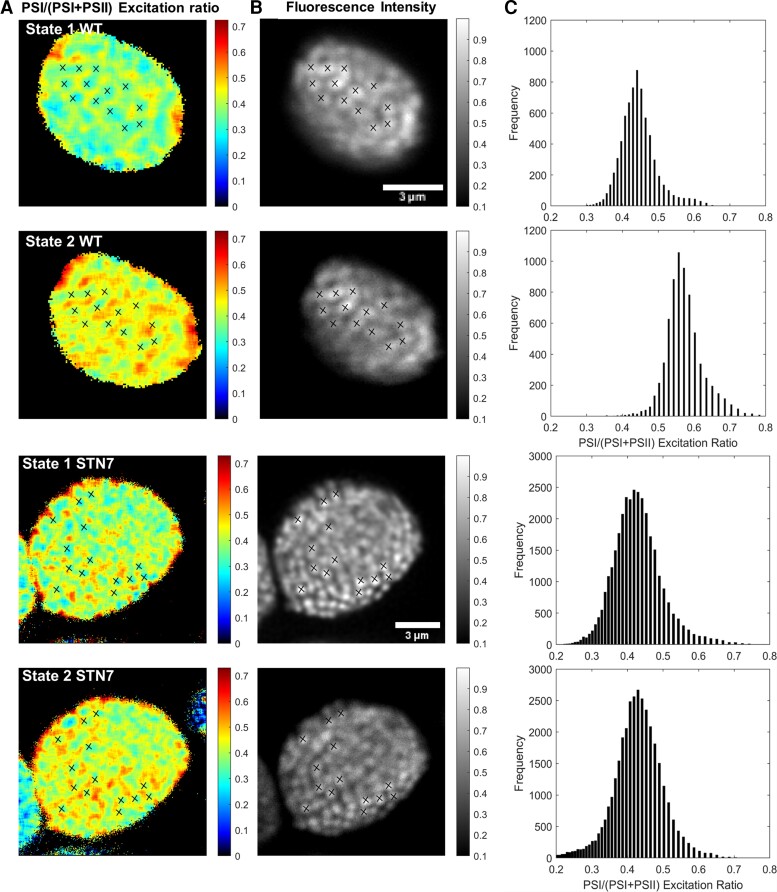
Figure 3.
Fluorescence lifetime images of WT and STN7 Arabidopsis plants in state 1 and state 2. A, The PSI/(PSI + PSII) excitation ratio. B, The fluorescence intensity. C, Histogram with the PSI/(PSI + PSII) excitation ratios and their counted pixel frequency are shown. In the rows from top to bottom, state 1 and state 2 from WT and state 1 and state 2 from STN7 are shown. The crosses mark the grana stacks that can be found on the fluorescence intensity image of state 1. The same crosses are displayed on the PSI/(PSI + PSII) excitation ratio images and fluorescence intensity image of state 2. Because of chloroplast movement in between the measurements, the markers had to be rotated 7 degrees for WT, to fit the fluorescence intensity and PSI/(PSI + PSII) excitation ratio images of state 2. To avoid fitting noise, the background fluorescence signal (typically 10% of the maximum fluorescence intensity) was removed.

