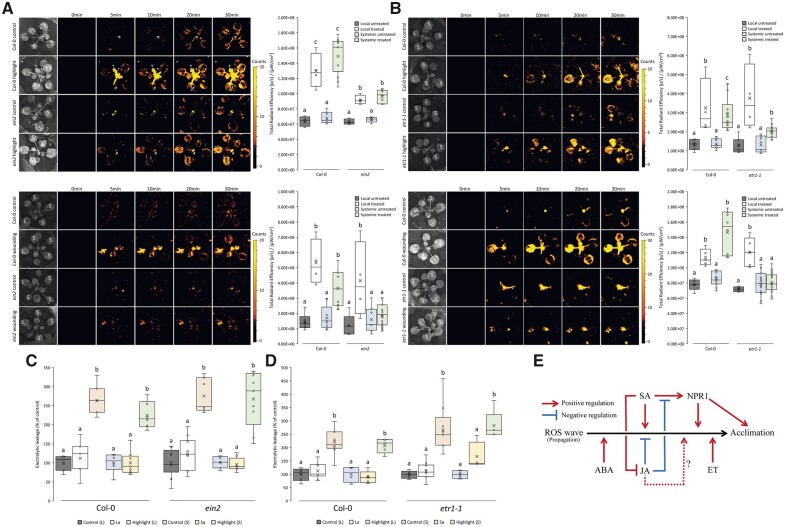
Figure 5.
ET insensitive mutants are unable to mount a systemic ROS wave response following a local wounding treatment, and a model. A, Arabidopsis plants were subjected to a HL stress or wounding treatments applied to a single leaf (L, Local), and ROS accumulation was imaged, using H2DCFDA, in whole plants. Representative time-lapse images of whole plant ROS accumulation in WT and ein2 plants are shown alongside box plots of combined data from all plants used for the analysis at the 0- and 30-min time points (L and systemic [S] leaves). B, Similar to (A), except for the etr1-1 mutant. C, Ion leakage measurements of L and S leaves in Col-0 and ein2 plants following HL stress. Local and systemic leaves that were exposed to an extended period of HL stress with no pretreatment (highlight), pretreated with HL for a short period of time and allowed to incubate prior to extended light exposure (local acclimated, La; and systemic acclimated, Sa), and control plants receiving no pretreatment, were measured. D, Similar to (C), except for the etr1-1 mutant. E, A model depicting the interactions between different plant hormones, the ROS wave and plant acclimation. All experiments were repeated at least three times with three plants per repeat. Two-way ANOVA followed by Tukey’s post-hoc test was conducted for the statistical analysis. Letters represent a statistically significant difference of at least P < 0.05. Results for each experiment are displayed as box-and-whisker plots, with the borders corresponding to the 25th and 75th percentiles of the data. Each data value is included as a point within each box plot, with the horizontal line representing the median and “X” corresponding to the mean. Whiskers represent 1.5 times the minimum and maximum of the mean (1.5 times of the interquartile range).

