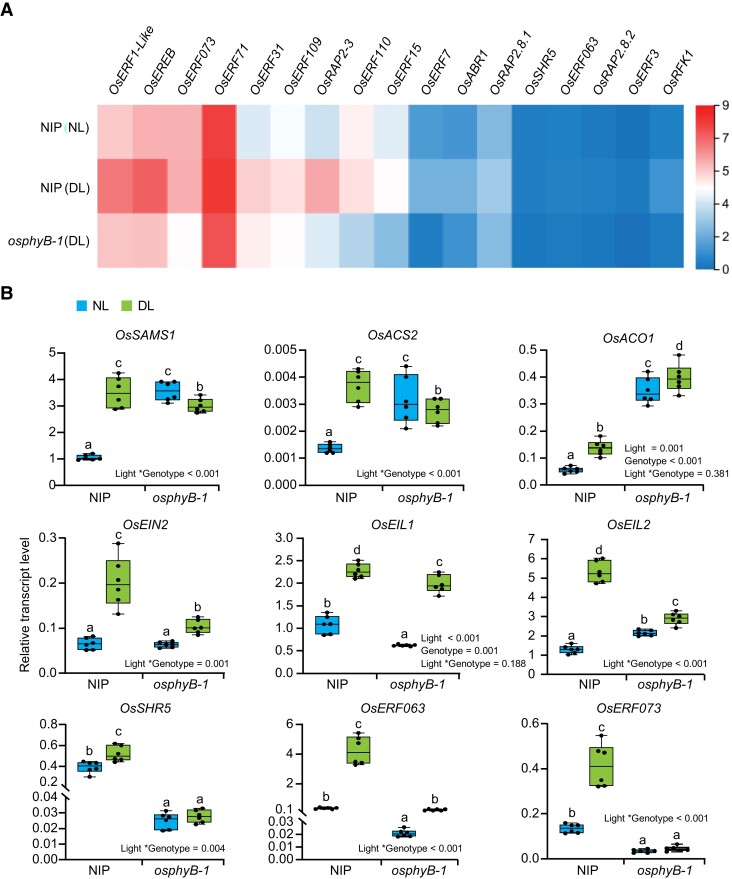
Figure 2.
Dim light up-regulates the expression of the ethylene pathway-related genes. A, Heatmap showing the expression of downstream target genes of OsEIL2 in WT (NIP) under NL (top), NIP under DL (middle) and osphyB-1 under DL (bottom). The color scale represents log2 fold change. B, RT-qPCR assay showing the transcript levels of ET pathway-related genes in NIP and osphyB-1 under NL and DL. The mean separation tests are shown with box plots. The center lines of the box plots indicate the median, the bounds of the box show the 25th and the 75th percentiles, and the whiskers indicate 1.5 × IQR. n ≥ 3 independent experiments. Different letters designate significantly different means by 2-way ANOVA + Tukey's post hoc test (P < 0.05). Interaction P value is shown in the inset.

