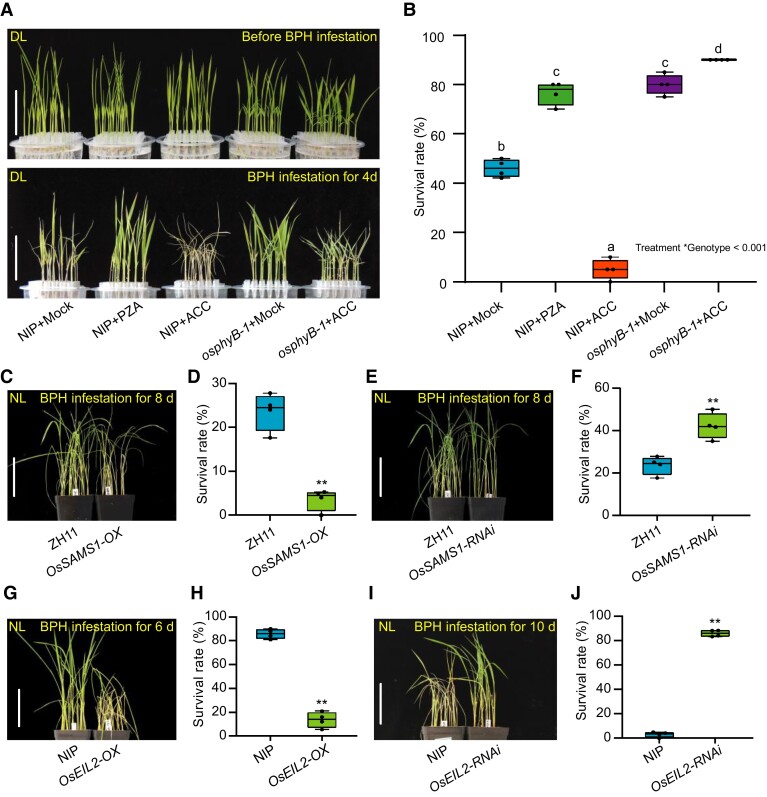
Figure 3.
ET negatively regulates BPH resistance in rice. A, Seedlings of WT (NIP) or osphyB-1 were incubated in Hoagland solution under NL conditions for one week, and were pretreated with Hoagland solution (mock), 50 μM ACC or 50 μM pyrazinamide (PZA) for 2 d (upper), and then infested with BPH for 4 d (bottom) under DL. Bar, 5 cm. B, Seedling survival rate of one-week old NIP and osphyB-1 seedlings in Hoagland solution pre-incubated with mock, 50 µM PZA or 50 µM ACC for 2 d and infested with BPH for 4 d. The mean separation tests are shown with box plots. The center lines of the box plots indicate the median, the bounds of the box show the 25th and the 75th percentiles, and the whiskers indicate 1.5 × IQR. n ≥ 3 independent experiments, with each pooled with 20 individual plants. Different letters designate significantly different means by 2-way ANOVA + Tukey's post hoc test (P < 0.05). Interaction P value is shown in the inset. C and D, Representative images (C) and seedling survival rate (D) of WT (ZH11) and OsSAMS1 overexpressing transgenic plants (OsSAMS1-OX) at 8 dpi with BPH under NL. Bar, 7 cm. E and F, Representative images (E) and seedling survival rate (F) of ZH11 and OsSAMS1-RNAi at 8 dpi with BPH under NL. Bar, 7 cm. G and H, Representative images (G) and seedling survival rate (H) of WT (NIP) and OsEIL2-OX at 6 dpi with BPH infestation under NL. Bar, 7 cm. I and J, Representative images (I) and seedling survival rate (J) of WT (NIP) and OsEIL2-RNAi at 10 dpi with BPH infestation under NL. Bar, 7 cm. In D, F, H, and J, the center lines of the box plots indicate the median, the bounds of the box show the 25th and the 75th percentiles, and the whiskers indicate 1.5 × IQR. (n ≥ 3 independent experiments, with each pooled with 25 individual plants), ** P < 0.01 by Student's t-test.

