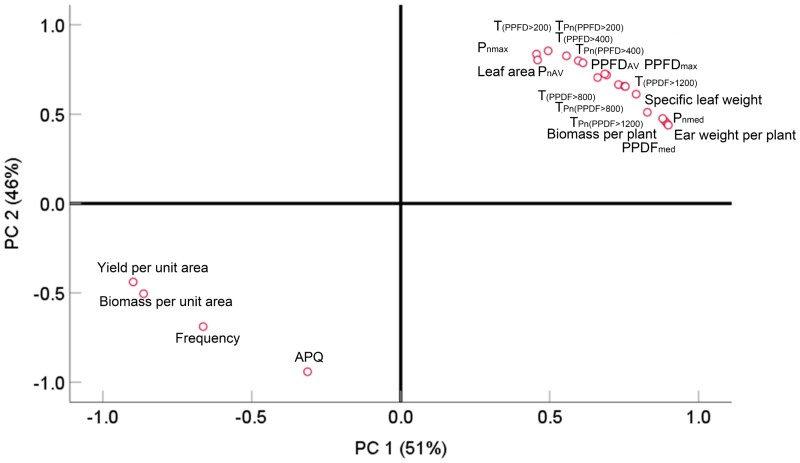
Figure 10.
Principal component analysis of morphological and physiological indexes under different planting densities. AQY, the maximum apparent quantum yield; PPDFmax, PPDFmed, and PPDFAV represent the maximum, median, and average value of light intensity, respectively; Pnmax and Pnmed represent the maximum and median net photosynthetic rate, respectively; PC, principal component; T(PPDF > 200), T(PPDF > 400), T(PPDF > 800), and T(PPDF > 1200) represent the duration of high light when the light intensity was higher than 200, 400, 800, and 1,200 μmol m−2 s−1, respectively. TPn (PPDF > 200), TPn (PPDF > 400), TPn (PPDF > 800), and TPn (PPDF > 1200) represent the duration of photosynthesis when the light intensity was higher than 200, 400, 800, and 1,200 μmol m−2 s−1, respectively.

