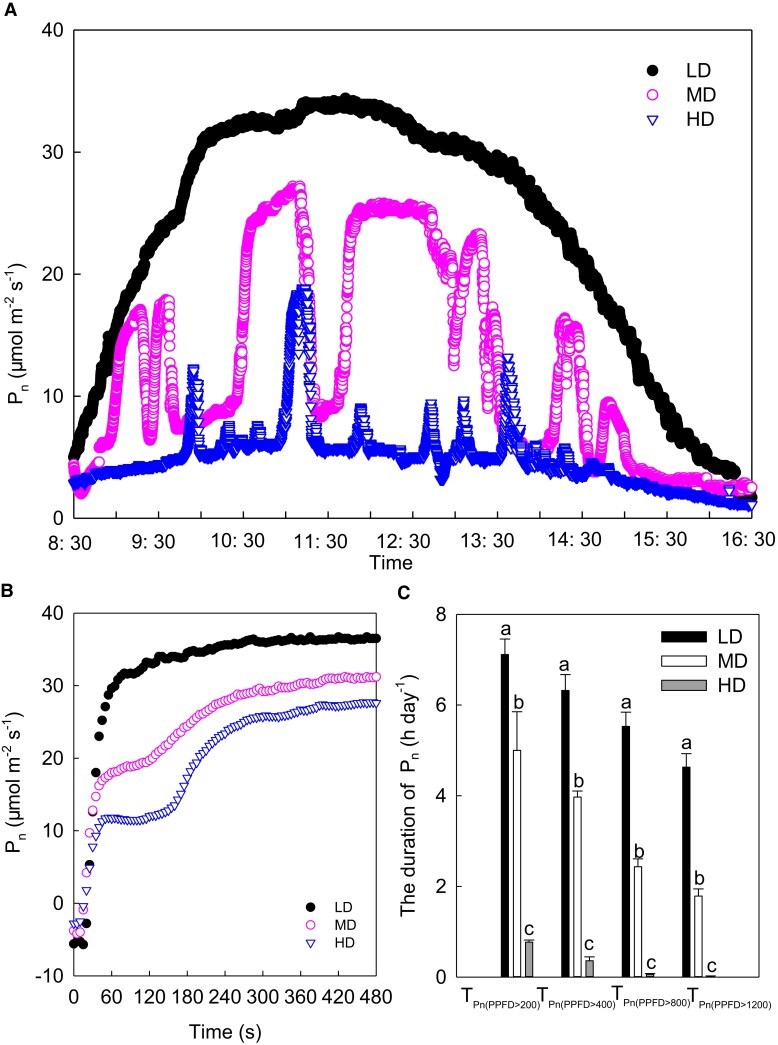
Figure 3.
Effects of planting density on the diurnal course of gas exchange and photosynthetic induction in maize ear leaves. (A) Diurnal course of photosynthesis (n = 3); (B) photosynthetic induction curve (n = 5); (C) duration of photosynthesis occurring at light levels greater than a specific light intensity (n = 3). Data are means ± standard error. Different lowercase letters indicate statistically significant (1-way ANOVA and LSD test) differences between different densities at the P < 0.05 level. Pn, net photosynthetic rate; TPn (PPFD > 200), TPn (PPFD > 400), TPn (PPFD > 800), and TPn (PPFD > 1200) represent the duration of photosynthesis when the light intensity was higher than 200, 400, 800, and 1,200 μmol m−2 s−1. LD, low planting density; MD, medium planting density; HD, high planting density.

