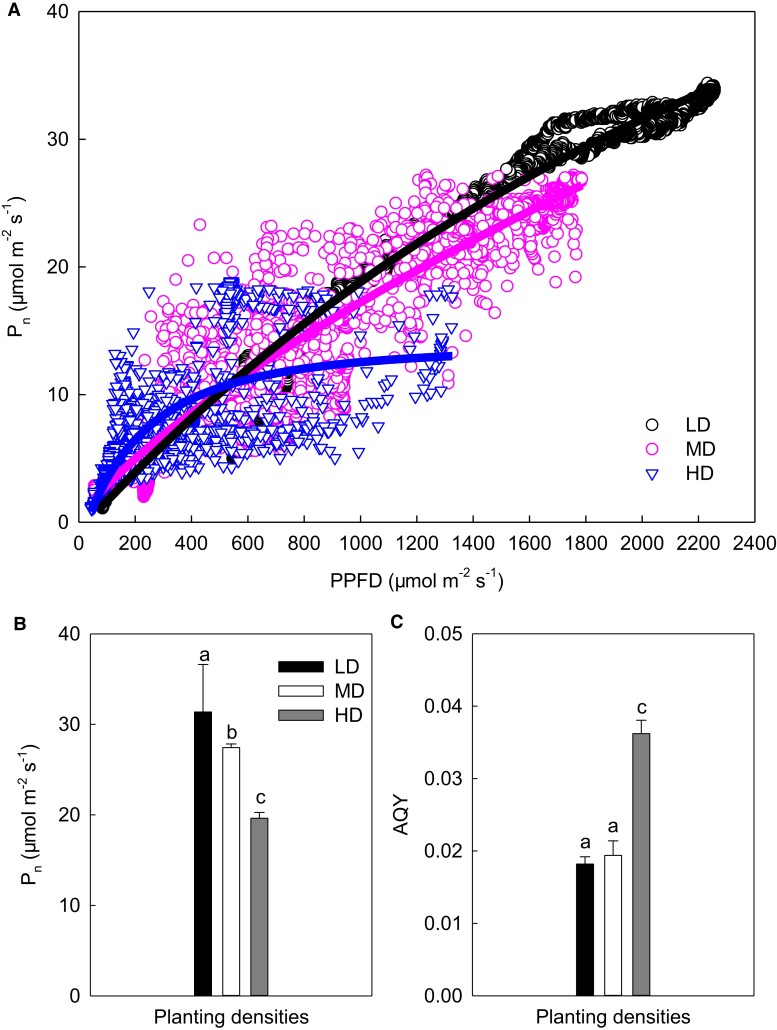
Figure 4.
Effects of planting density on photosynthesis-light curves in maize ear leaf. (A) The photosynthesis-light curves; (B) maximum photosynthetic rate; (C) maximum apparent quantum yield. The simulation equations in A are as follows: y = 55.66–56.3136/(1 + 9.1824E−010x)1/2.1635E^−006 (R2 = 0.9820); y = −5.229 + 5.7170/(1 + 0.0071x)−1/1.5322 (R2 = 0.9249); and y = 13.8495–15.6104/(1 + 0.0019x)1/0.4249 (R2 = 0.6776). Data are means ± standard error (n = 3). Different lowercase letters indicate statistically significant (1-way ANOVA and LSD test) differences between different densities at the P < 0.05 level. Pn, net photosynthetic rate; LD, low planting density; MD, medium planting density; HD, high planting density; PPFD, photosynthetic photon flux density; AQY, the maximum apparent quantum yield.

