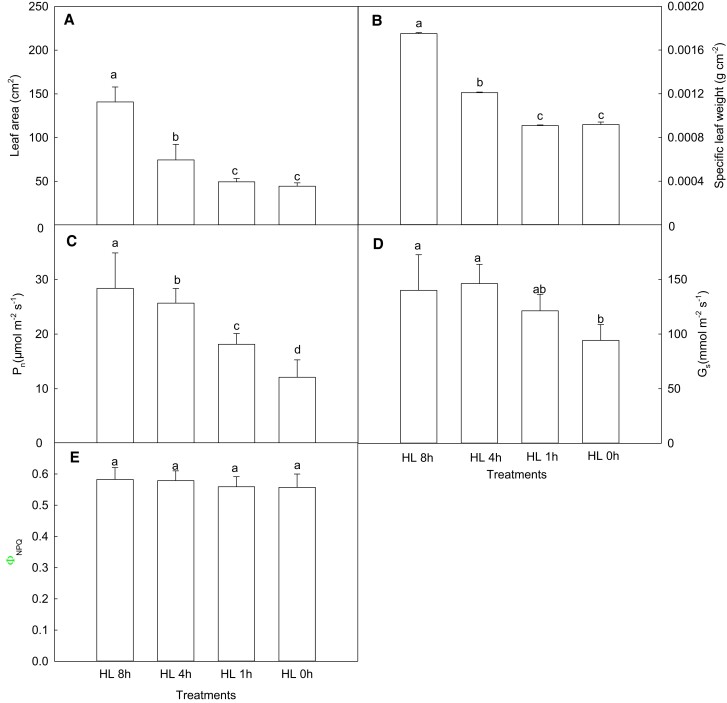
Figure 8.
Effects of the duration of high light on leaf morphology, gas exchange, and chlorophyll a fluorescence quenching in maize leaves. (A) Leaf area (n = 5); (B) specific leaf weight (n = 5); (C) photosynthetic rate (n = 6); (D) stomatal conductance (n = 6); (E) the quantum yield of regulatory energy dissipation (n = 6). HL 0 h represents weak light (200 μmol m−2 s−1); HL 1 h, HL 4 h, and HL 8 h represent treatments in which the duration of high light increased by 1, 4, and 8 h on top of weak light (200 μmol m−2 s−1), respectively. Data are means ± standard error. Different lowercase letters indicate statistically significant (1-way ANOVA and LSD test) differences between different treatments at the P < 0.05 level. Pn, net photosynthetic rate; Gs, stomatal conductance; ΦNPQ, the quantum yield of regulatory energy dissipation.

