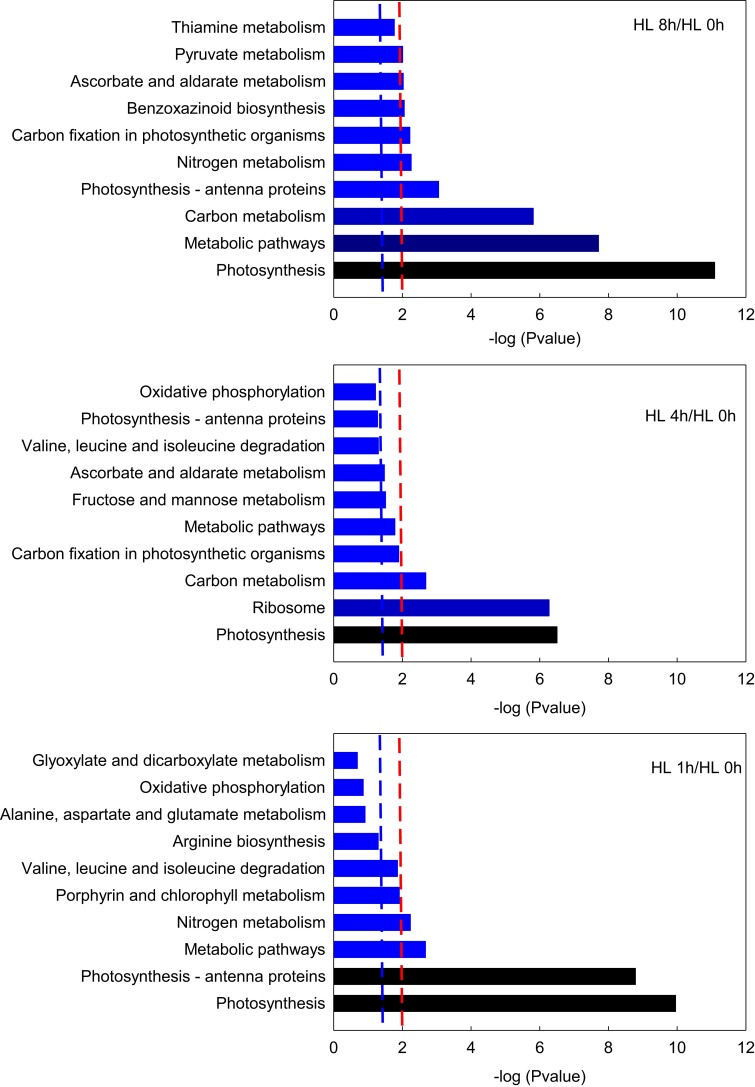
Figure 9.
Enriched KEGG pathways of differentially abundant proteins in maize leaves under different durations of high light. The vertical coordinates and the horizontal coordinates represent the KEGG pathway and −log (P-value), respectively. The right line indicates a P-value of 0.01, and the left line shows a P-value of 0.05. When the right edge of the bar is past the left line or the right line, the biological process it represents is significant, with extremely significant biological processes beyond the right line and significant processes beyond the left line. KEGG, Kyoto encyclopedia of genes and genomes.

