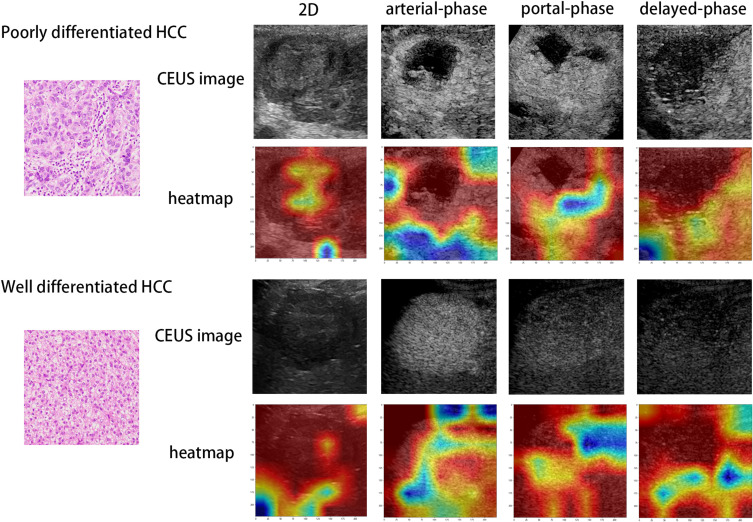
Figure 7.
Visualization of two patient examples. CEUS and heatmap of poor-differentiation patients in the first and second rows, while CEUS and heatmap of well - differentiation patients in the third and fourth rows. The first to fourth columns are two-dimensional ultrasound, arterial-phase, portal-phase and delayed-phase. Red highlights the active regions associated with poorly differentiated differentiation.

