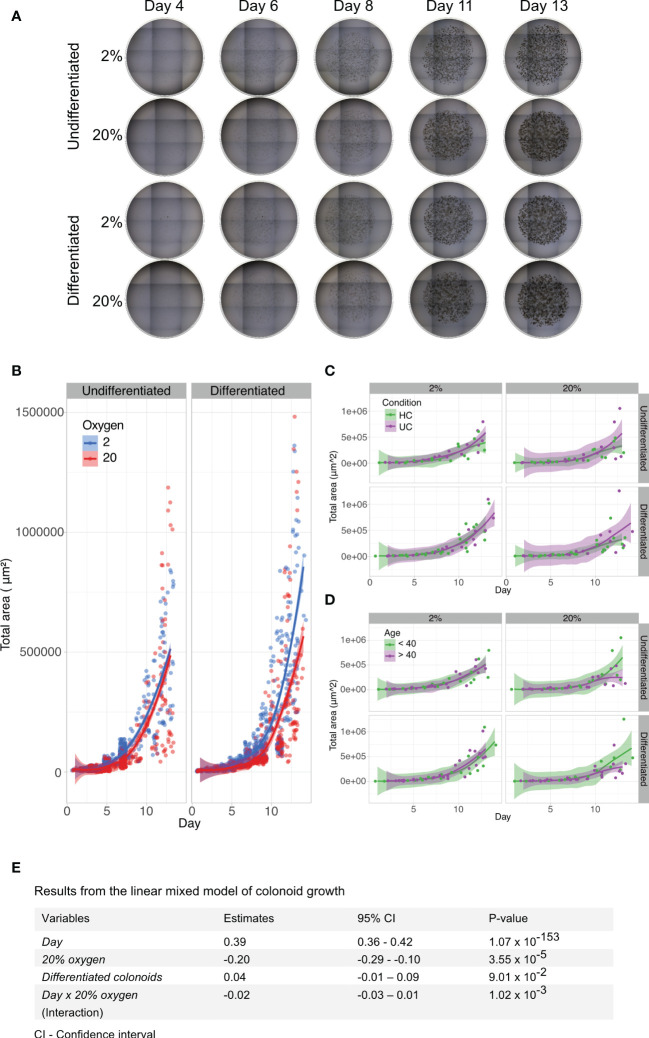
Figure 2.
Brightfield image analyses and linear mixed model of colonoid growth. (A) Two dimensional (2D) brightfield images (4x magnification, EVOS microscope) of Matrigel domes containing undifferentiated or differentiated colonoids cultured in parallel at 2% and 20% oxygen. Nine tiled images captured every dome within one technical replicate (i.e., plate well) throughout the experiment. The day of image acquisition is indicated above the images; the oxygen environment and the differentiation status are shown on the left. (B) Computational growth analysis of colonoid cultures (n=11 independent experiments, with 6-12 technical replicates (i.e., plate wells) per condition. Table 1 and Supplementary Figure 2B ). Days are marked on the x-axis, while the y-axis shows the total colonoid mass in 2D. Timepoints with blue circles represent 2% oxygen cultivation, and red circles represent 20% oxygen cultivation in undifferentiated (left panel) and differentiated (right panel) colonoids. The blue (2% oxygen) and red (20% oxygen) lines were fitted with the Loess curve fitting model. (C) Colonoid growth curve of ulcerative colitis (n=2) and healthy control donors (n=5), with data from independent experiments with the same donor merged). The x-axis represents time, while the y-axis shows the total colonoid mass in 2D. Timepoints with purple circles represent ulcerative colitis donors, and green circles represent healthy control donors. Undifferentiated colonoids (left panel) and differentiated (right panel). The purple (ulcerative colitis) and green (healthy controls) lines were fitted with the Loess curve fitting model. (D) Colonoid growth patterns of donors < 40 years (n=3) and > 40 years (n=4)). The x-axis represents time, while the y-axis shows the total colonoid mass in 2D. Timepoints with purple circles represent old donors, and green circles represent young donors. Undifferentiated colonoids (left panel) and differentiated (right panel). The purple (> 40) and green (< 40) lines were fitted with the Loess curve fitting model. (E) A linear mixed model based on data from 1875 images was used to quantify which variables impacted colonoid growth. In the table, fixed variables are listed in the first column. The middle columns are absolute values of how much the variables affected growth, with an estimate of the impact in the left-middle column and 95% confidence intervals in the column to the right. P-values are listed in the last column.

