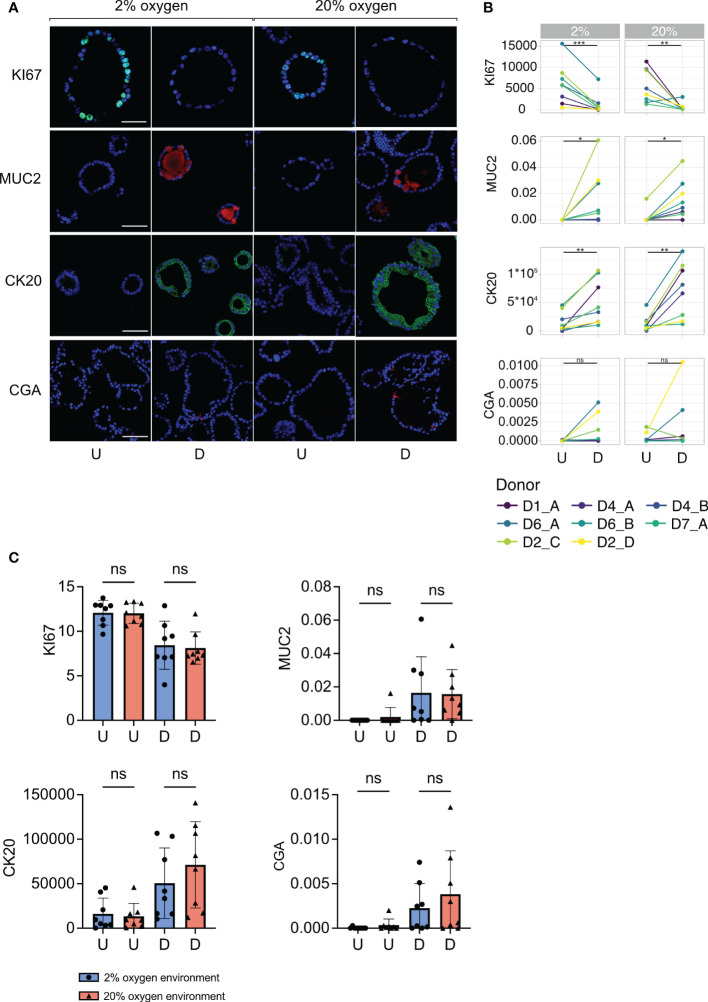
Figure 3.
Cell marker protein expression in undifferentiated and differentiated colonoids at low and high oxygen. (A) Immunofluorescent images of cell marker expression. Images in the two first columns show colonoids cultured in 2% oxygen, while the images in the last two columns show colonoids cultured in 20% oxygen. Within each oxygen concentration, U indicates the undifferentiated condition, while D indicates the differentiated condition. Each row represents a cell marker protein. DAPI was used as a counterstaining in all images. Scalebar = 50 μm. (B) Paired quantification of cell marker expression in undifferentiated (U) and differentiated (D) colonoids (n=8 independent experiments, Table 1 ). Statistical testing was carried out with the Wilcoxon test. The x-axis shows the differentiation condition of the colonoids while the y-axis shows calculated expression: CK20 and KI67 expressions were quantified with corrected total cell fluorescence (CTCF) adjusted for the number of cells present. The y-axis for MUC2 and CGA indicates the fraction of positive cells, manually counted, among all present cells. (C) Cell marker protein expression in colonoids cultured at 2% vs. 20% oxygen. The bars show the mean and standard deviation with each independent experiment plotted as individual values. Blue bars and dots illustrate colonoids cultured in 2% oxygen and red bars and triangles cultured in 20% oxygen. The x-axis shows the conditions undifferentiated (U) or differentiated (D), while the y-axis shows cell marker expression. P-values are determined by one-way ANOVA followed by Šidák’s multiple comparisons test. ns = non-significant.

