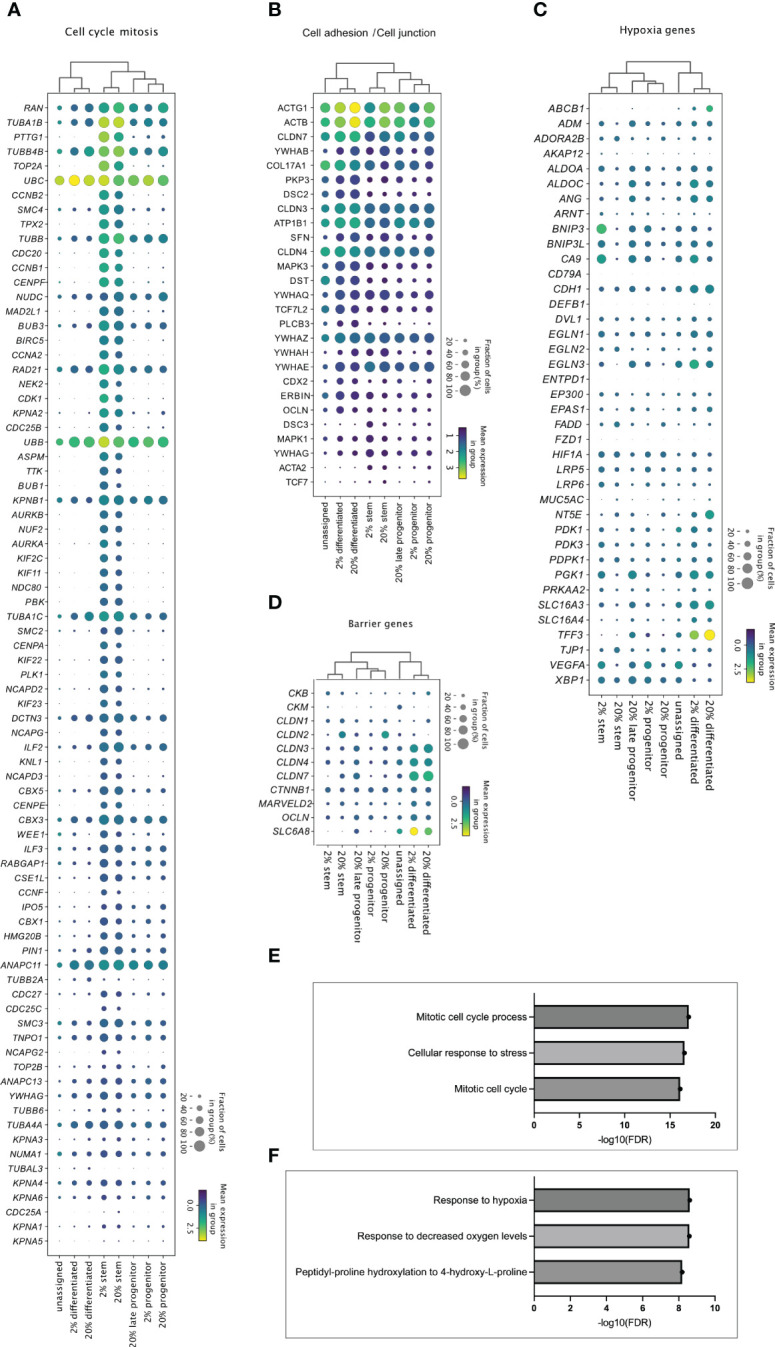
Figure 5.

Cell cluster specific transcriptome in 2% and 20% oxygen. Enrichment analysis of upregulated genes in the stem, progenitor, and differentiated cell clusters from 2% vs. 20% oxygen culture (adjusted P <0.05). were generated with MetaCore+MetaDrug™ version 21.3 build 70600 ( SF1 , sheets 12-15). The dot plots display how (A) genes related to cell cycle and mitosis (A), genes associated with cell adhesions and cell junctions (B), hypoxia-related genes (C) and barrier genes (D) were expressed in the different cell type clusters. Cell clusters are listed along the x-axis, while genes are listed along the y-axis. The color intensity represents mean expression within a cluster, and the radius of the dot represents the fraction of cells in the cluster expressing a gene. (E, F) Bars indicate –Log10 false discovery rate (FDR), while the y-axis lists top three GO processes upregulated in stem-like cell clusters (E) and differentiated cell cluster (F) in 2% compared to 20% oxygen culture ( Supplementary file SF1 , sheets 14 and 15, respectively).
