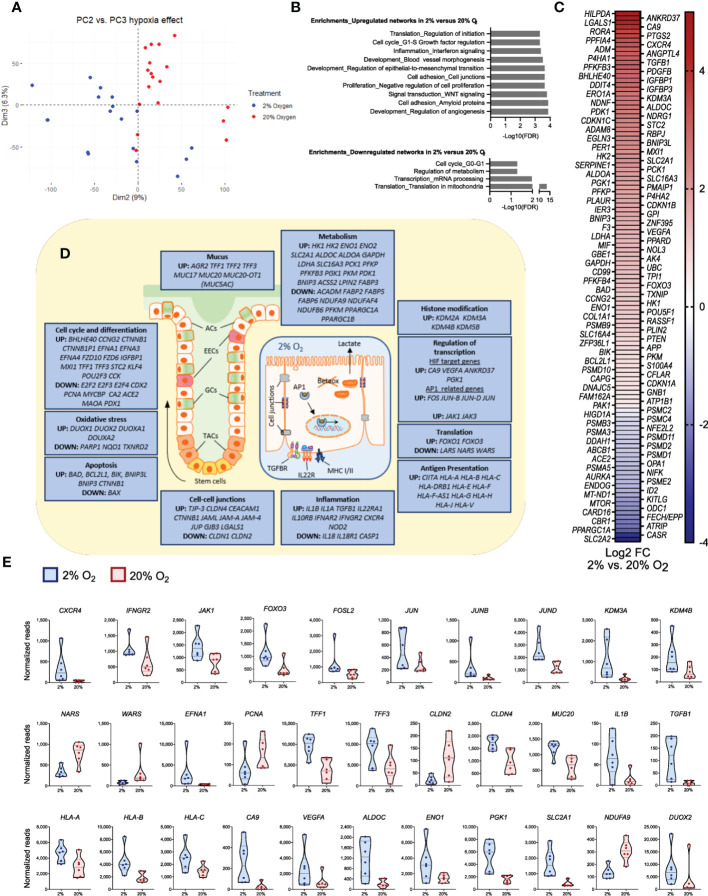
Figure 7.
Significant changes in epithelial gene expression after a short time reduction of oxygen. The panels show data from bulk RNA-seq analysis of differentiated colonoids grown continuously at 20% or at 2% for the last 40 hours. (A) PCA plot of PC2 vs. PC3 for the complete dataset from GSE172404 (38) captures the influence of oxygen levels. Dots represent individual samples. (B) Enrichment analysis of basal gene expression in colonoids grown at 2% compared to 20% oxygen. Networks (top ten) best associated with upregulated genes (n=1192) and networks (top four) best associated with downregulated genes (n=1192), analyzed using MetaCore™ version 6.34 build 69200. The strength of association is given as -Log10 false discovery rate (FDR). (C) Differential expression of curated hypoxia-related genes (n=119) in 2% oxygen compared to 20% oxygen (adjusted P-values < 0.05). The heatmaps are sorted from highest (red) to lowest (blue) log2 fold change (FC) values, with 89 upregulated and 30 downregulated genes in 2% compared to 20% O2. (D) Illustrations of a colonic crypt with mucus lining and a colonic epithelial cell. The blue boxes contain a selection of differentially regulated genes between colonoids at 2% or 20% oxygen (adjusted P-values < 0.05), grouped by intestinal epithelial cell functions. Upregulated or downregulated genes at 2% compared to 20% oxygen are mentioned in boxes according to the topic. ACs, absorptive cells; EECs, enteroendocrine cells; GCs, goblet cells; TACs, Transit-amplifying cells; TGFBR, transforming growth factor beta receptor; IL22R, Interleukin 22 receptor complex; Betaox, beta-oxidation of fatty acids; MHC, major histocompatibility complex; AP1, network of transcription factors involved in inflammation. (E) Expression of a subset of genes within the different groups of intestinal epithelial cell functions described in (D), given as normalized reads. The first 12 panels show genes related to signal transduction, transcription, and translation; the latter show effector genes important for intestinal epithelial cell homeostasis. See main text for details. All displayed genes in the figure panels were differentially regulated with an adjusted P-value <0.05.

