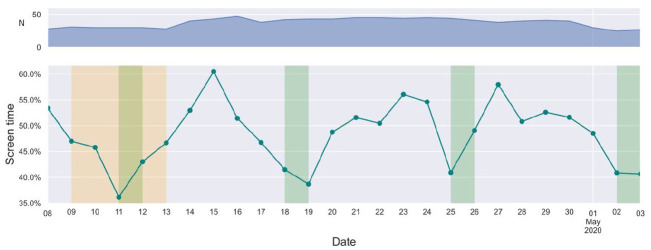
Figure 2.
Top graph: the total number of participants having filled out data for screen time for each given day from 8th of April to 3rd of May, 2020. Bottom graph shows the mean amount of screen time for participants per day as a percentage of mean number of hours awake during that day. Y-axis shows range from 35% to 60%. Heavy shading indicates weekends, medium shading indicates Danish Easter holiday (9–13 April 2020).

