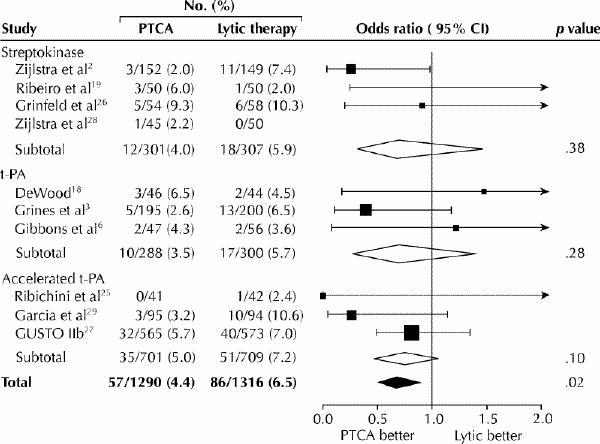
Fig. 5: Mortality at the end of the study period in 10 trials comparing direct PTCA with thrombolytic therapy. The rates for each study are grouped by thrombolytic regimen. Odds ratios with 95% confidence intervals (CIs) are plotted on the right. [Reprinted, with permission, from Weaver WD et al.16 © 1997, American Medical Association.
