Fig. 4.
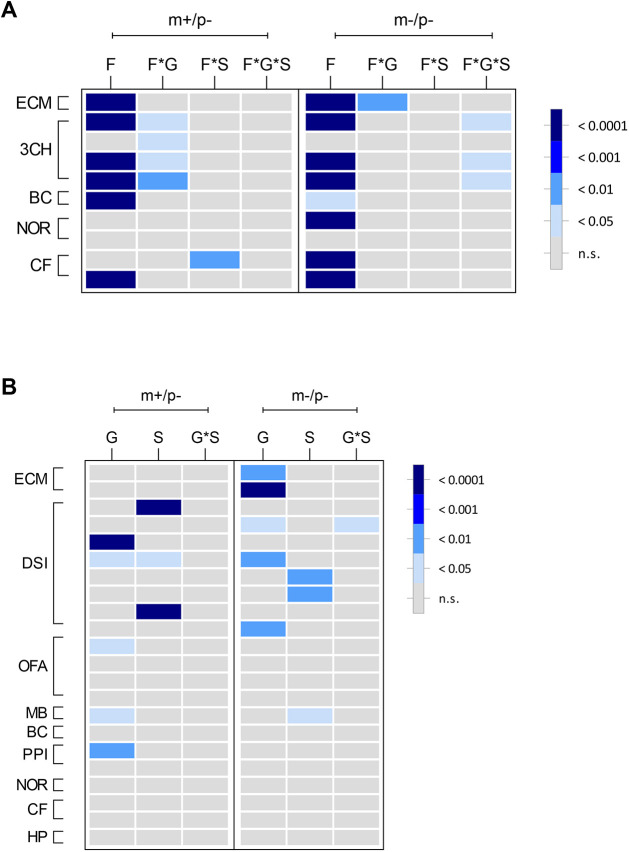
Summary heatmap representation of mutant Magel2 rat behavioral outcomes. (A,B) Graphical representation showing the degree of statistical significance for both mutant Magel2 lines relative to their wild-type littermate controls. Each row corresponds to a specific test parameter of the indicated procedure to the left outlined in brackets. Within each mutant line (shown along top of graph as m+/p− or m−/p−), each column represents the main effect or interaction for each statistical analysis. In each panel legend, the degree of statistical significance is indicated by relative gray to dark-blue color, each corresponding to a P-value ranging from not significant (n.s.) to P<0.0001. (A) For applicable procedures, repeated measures (RM) ANOVA was conducted for specific parameters of the elevated circle maze (ECM), three-chamber test (3CH), block-chew test (BC), novel object recognition test (NOR) and conditioned fear test (CF). F, factor; F*G, factor-by-genotype; F*S, factor-by-sex; F*G*S, factor-by-genotype-by-sex. (B) For parameters that were not analyzed by RM ANOVA, multivariate two-way ANOVA using genotype and sex as main effects followed by post-hoc analyses was conducted for ECM, 3CH, direct social interaction (DSI), open-field assay (OFA), marble burying test (MB), BC, acoustic startle and prepulse inhibition (PPI), NOR, CF and hot-plate test (HP). G, genotype; S, sex; G*S, genotype-by-sex. Specific parameters for each row in A and B are provided in Table S1.

