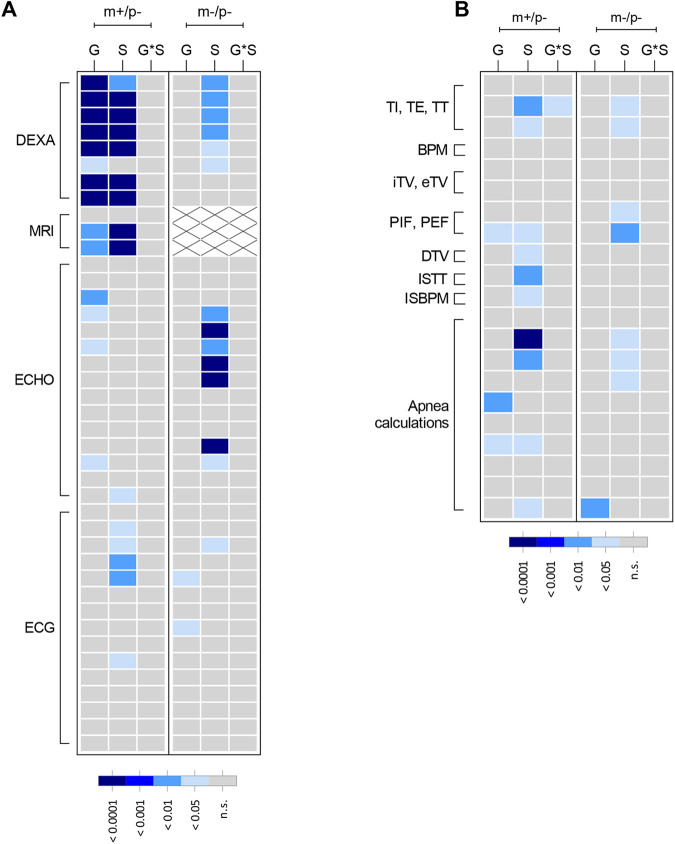
Fig. 7.
Summary heatmap representation of mutant Magel2 rat physiology and plethysmography outcomes. Graphical representation showing an overview of the degree of statistical significance for both mutant Magel2 lines studied relative to their wild-type littermate controls. Each row corresponds to a specific test parameter of the indicated procedure to the left outlined in brackets. Within each mutant line studies (shown along top of graph as m+/p− or m−/p−), each column represents the main effect or interaction for each statistical analysis. As shown in each panel legend, the degree of statistical significance is indicated by relative gray to dark-blue color, with each color corresponding to a P-value ranging from not significant (ns) to P<0.0001. For MRI, white boxes with ‘×’ indicate not measured. (A) Multivariate two-way ANOVAs with post-hoc analyses were conducted and graphically displayed for dual-energy x-ray absorptiometry (DEXA), quantitative magnetic resonance technology (MRI), echocardiogram (ECHO) and electrocardiography (ECG). (B) Multivariate two-way ANOVAs with post-hoc analyses were conducted and graphically displayed for parameters collected during unrestrained whole-body plethysmography. Parameters displayed are inspiratory time (TI), expiratory time (TE), total breath time (TT), breaths per minute (BPM), inspiratory tidal volume (iTV), expiratory tidal volume (eTV), peak inspiratory flow (PIF), peak expiratory flow (PEF), tidal volume (DTV), ratio TT change (ISTT) and ratio BPM change (ISBPM). Parameters for each row in A and B are provided in Table S2. G, genotype; S, sex; G*S, genotype-by-sex.

