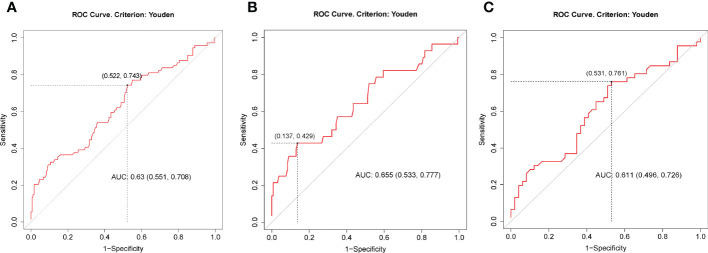
Figure 2.
ROC curves for preoperative TSH as a predictor of gastrointestinal side effects of liraglutide among all patients (A), males (B) and females (C). The best cutoff points in (A, B, C) were 1.37 (specificity = 0.48, sensitivity = 0.74), 2.30 (specificity = 0.86, sensitivity = 0.43) and 1.33 (specificity = 0.47, sensitivity = 0.76), respectively. AUC, area under the ROC curve.

