Fig. 2.
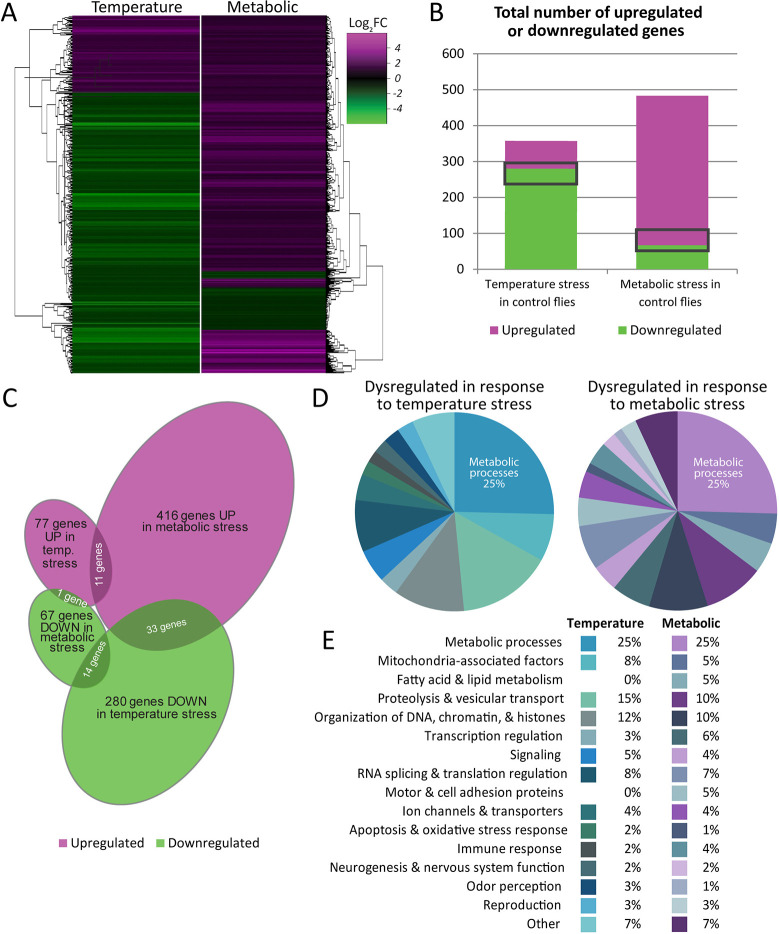
Temperature and metabolic stress result in distinct transcriptional changes. (A) Heat maps depicting all genes dysregulated in control flies by either temperature or metabolic stress, irrespective of their levels of expression in the DGC mutants. (B) The numbers of genes dysregulated in control flies by temperature stress (357 genes) or metabolic stress (483 genes). Temperature stress is much more likely to cause the downregulation of genes, whereas metabolic stress causes more upregulation. Gray rectangles indicate the 59 genes that were dysregulated by both stressors. (C) Venn diagram illustrating the upregulation (UP) and downregulation (DOWN) of genes as a result of temperature or metabolic stress. The overlapping regions add up to the 59 genes dysregulated by both stressors. (D,E) Categories of all genes with known functions that are dysregulated in response to temperature or metabolic stress. Pie charts (D) provide a visual depiction of the relative fraction each gene category constitutes of the total. The table (E) lists categories and percentages for both stress conditions. The largest category in both pie charts is ‘Metabolic processes’ (25%), and the categories in the pie chart extend in a clockwise direction in the same order as in the table. See also Fig. S2.

