Figure 1.
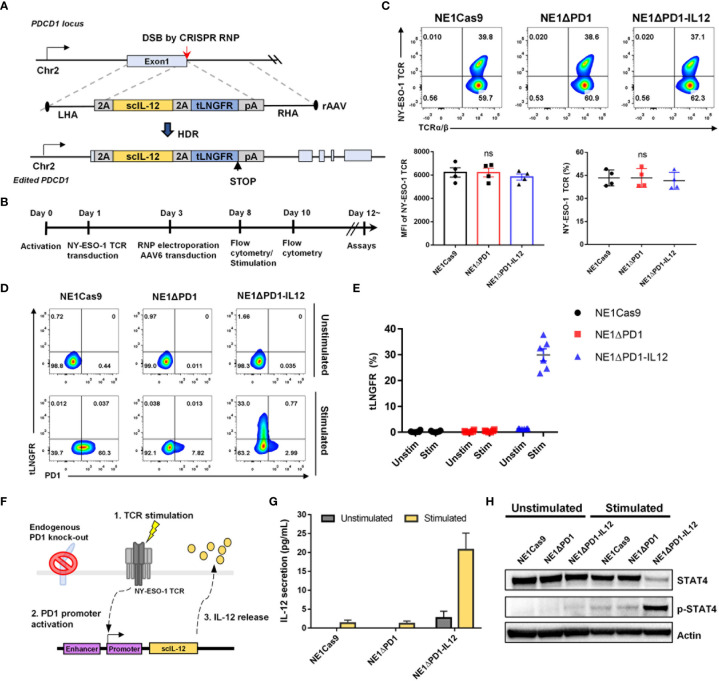
CRISPR-mediated PDCD1 locus editing to generate ΔPD-1-IL-12-NY-ESO-1-specific T cells. (A) Schematic diagram for the targeted insertion of IL-12 into the PDCD1 locus using CRISPR RNP and AAV6 delivery (LHA and RHA: left and right homology arms, respectively, 2A: self-cleaving peptide, 2tLNGFR: truncated low-affinity nerve growth factor receptor, pA: polyA signal). (B) Timeline for the consecutive lentiviral transduction, electroporation, and AAV6 transduction to generate ΔPD-1-IL-12-edited NY-ESO-1-engineered T cells. (C) Five days after electroporation, the surface expression levels of NY-ESO-1 TCR on engineered T cells were analyzed using flow cytometry and the percentage and mean fluorescent intensity (MFI) of NY-ESO-1 TCR were quantified (n = 4; four independent experiments with four donors). Data were analyzed using one-way ANOVA. ns, not significant. (D) Representative flow cytometry plot of PD-1 and tLNGFR upregulation in engineered T cells two days after stimulation with αCD3 and αCD28. (E) Percentage of tLNGFR in engineered T cells before and after stimulation. Data are presented as the mean ± SEM (n = 6; six independent donors). (F) Schematic diagram of the stimulation-dependent release of targeted IL-12 from the edited PDCD1 locus. (G) After T cells were stimulated with A375 cells for 2 days, the amount of IL-12 secreted into the culture supernatant was measured using a CBA assay. Data are presented as the mean ± SEM (n = 3; three independent experiments with three donors). (H) Representative western blot image showing Tyr 693 phosphorylation of STAT-4 in NYESO1-ΔPD-1-IL-12 T cells before and after stimulation with αCD3 for 3 days (n = 3; three donors).

