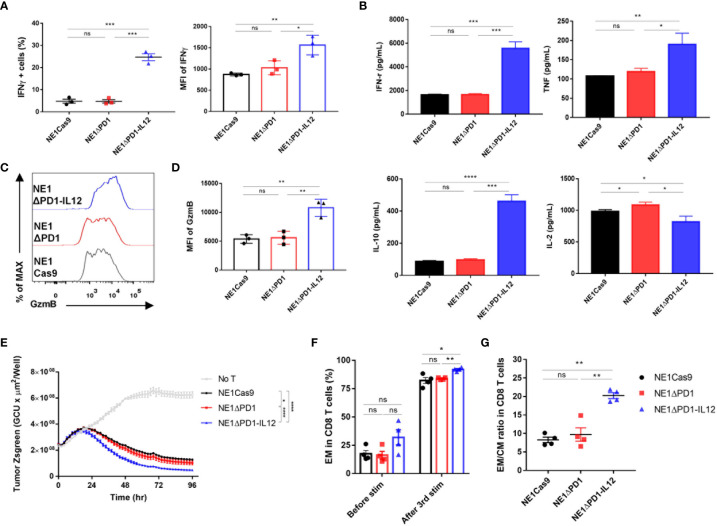
Figure 3.
Enhanced effector function of ΔPD-1-IL-12-edited NY-ESO-1 TCR-T cells in vitro (A) Engineered T cells were co-cultured with A375 cells for 24 h. IFN-γ secretion was determined using flow cytometry. The percentage of IFN-γ positive cells and the MFI of IFN-γ were quantified. Data are presented as the mean ± SEM (n = 3; three independent experiments with three donors). (B) Engineered T cells were co-cultured with A375 cells for 48 h and the cytokines (IFN-γ, TNF, L-10, and IL-2) released into the culture supernatants were measured by CBA assay; results shown are representative of three experiments with three different donors. Data are presented as the mean ± SD of triplicates. (C) Engineered T cells were co-cultured with A375 cells for 48 h. The GzmB expression was determined by intracellular flow cytometric analysis. (D) The MFI of GzmB in the engineered T cells shown in (C, E) Engineered T cells were co-cultured with Zsgreen+ A375 cells for 96 h. The green signal from tumor cells was measured using IncuCyte every 2 h. A decrease in the green signal indicates that tumor cells were killed; results shown are representative of three experiments. Data are presented as the mean ± SD. (F) Percentage of effector memory CD8 T cells (CD45RO+/CCR7–) after a third repetitive stimulation with A375-PDL1 tumor cells. (G) The ratio of effector memory to central memory (CD45RO+/CCR7+) CD8 T cells in (F) Data of F and G are presented as the mean ± SEM (n = 4; individual donors). The P-values of A, B, and D were determined by two-tailed unpaired t-test. The P-value of E was determined by repeated-measures ANOVA followed by Holm-Sidak’s multiple comparisons test. Data of F and G were compared by two-tailed paired t-test. *P<0.05, **P<0.01, ***P<0.001, and ****P<0.0001 were considered statistically significant. ns, not significant.

