Figure 5.
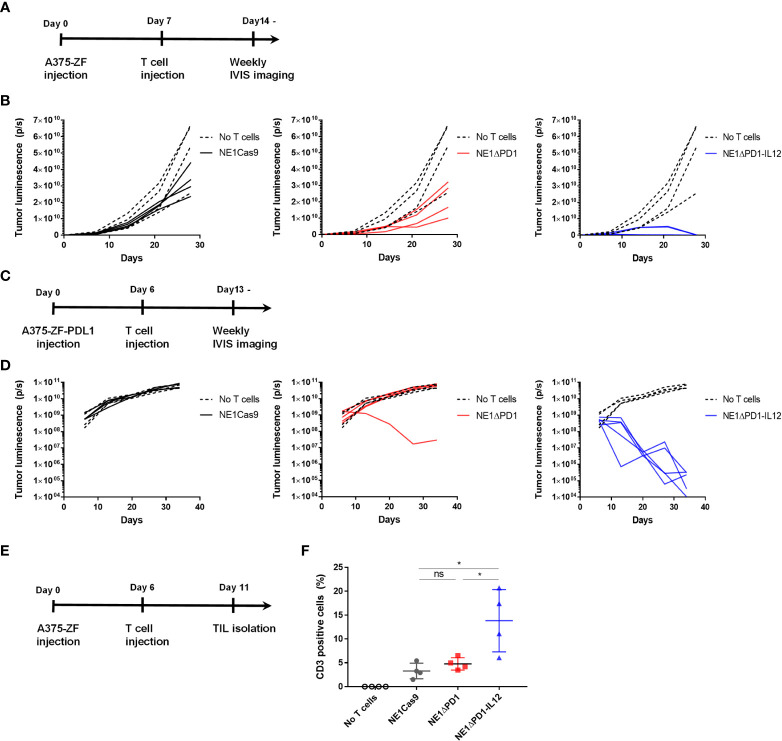
Enhanced anti-tumor activity of ΔPD-1-IL-12-edited NY-ESO-1 TCR-T cells in vivo (A) Timeline for in vivo experiment performed with A375-ZF tumor cells. Immunodeficient NSG mice were subcutaneously injected with 1 × 10⁶ A375-ZF cells. After 7 days, 1 × 10⁶ NY-ESO-1+ T cells were intravenously injected. The luminescence signal from tumor cells was measured weakly using an in vivo imaging system (IVIS). (B) Quantitative analysis of bioluminescent signal from individual mouse. ΔPD-1-IL-12 T cells exhibited superior anti-tumor activity (n = 4 mice per group). (C) Timeline for in vivo experiments performed using the PD-L1-overexpressed A375 model. Six days after subcutaneous injection of A375-ZF-PDL1 cells, 1 × 10⁶ NY-ESO-1+ T cells were intravenously injected. The luminescence signal from tumor cells was measured weekly using IVIS. (D) Quantitative analysis of bioluminescent signal from individual mouse. Tumors were cleared in only one of the PD-1 deleted NY-SO-1-treated mice. All NE1ΔPD-1-IL-12-treated mice were cured from tumors (n = 4 mice for no T cells and NE1Cas9, n = 5 mice for NE1ΔPD-1 and NE1ΔPD-1-IL-12). (E) Timeline for investigating engineered T cells infiltrated into the tumor site. A375-PDL1 tumor cells and NY-ESO-1 specific T cells were injected as in (C) At 11 d, the mice were sacrificed and tumors were harvested. Tumors were mechanically dissociated and the infiltrated T cells were analyzed by flow cytometry. (F) The percentage of CD3+ cells in tumor tissues (n = 4 mice per group). Data are presented as mean ± SEM. The P-value was determined by two-tailed unpaired t-test. *P<0.05 was considered statistically significant. ns, not significant.

