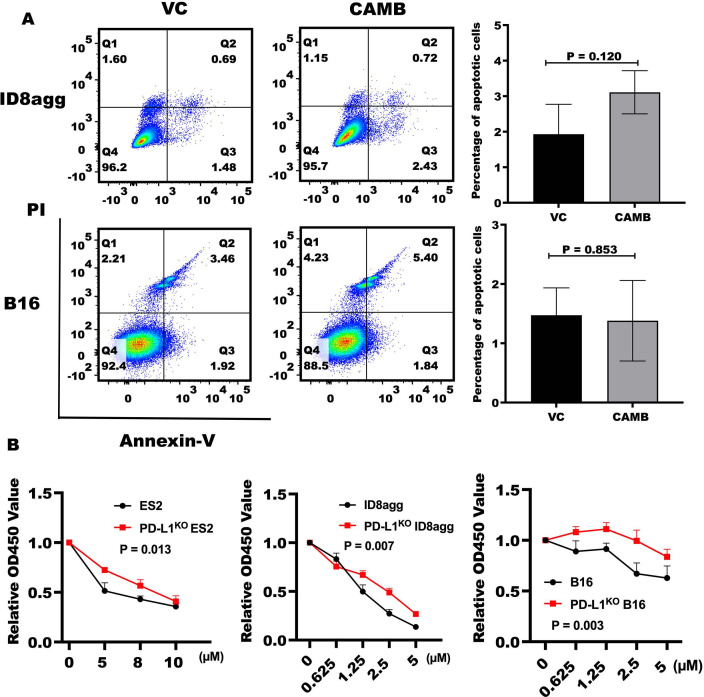
Figure 2.
Chlorambucil slows tumor cell growth in a tumor PDL1-dependent fashion. (A) Annexin V-FITC/propidium iodide (PI) staining by flow cytometry. In given plots: Q1, necrotic cells, Q2, late apoptotic cells, Q3, live cells and Q4, early apoptotic cells. ID8agg (upper panel) and B16 cells (lower panel) were treated with 2.5 µM chlorambucil for 48 hours. Numbers in each quadrant indicate percent cells. Summary and stats for total (early+late) apoptotic cells shown on the right. (B) Tumor cells were treated with indicated concentrations of chlorambucil for 48 hours. Cell viability was detected by CCK-8 assay and relative cell viability ratios were compared between control cells and genetically PDL1-depleted cells. Data represents three independent experiments. P value determined by unpaired t-test. VC, vehicle control.

