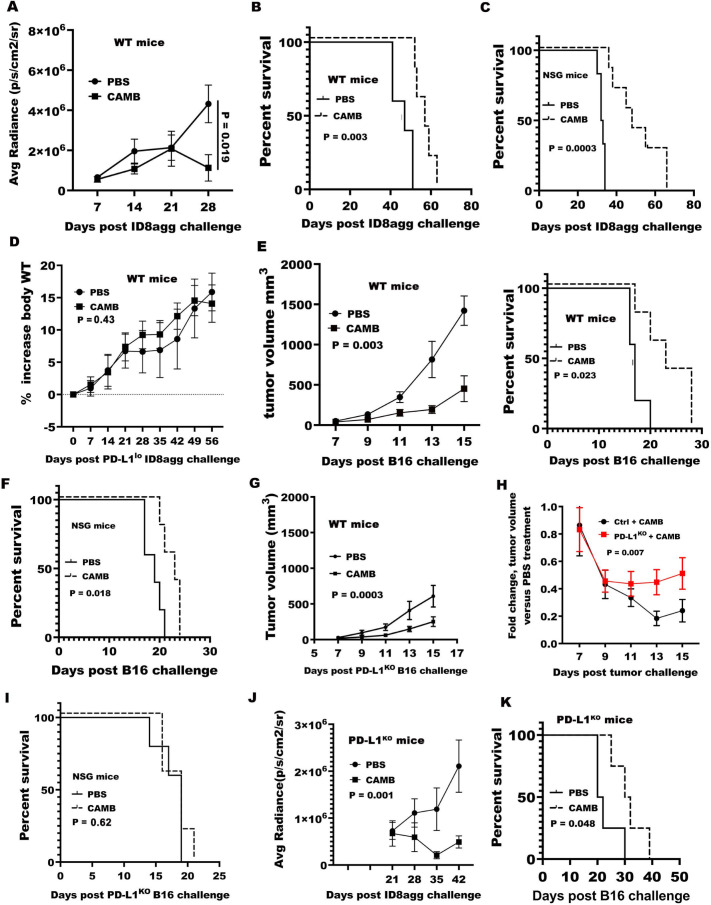
Figure 3.
Chlorambucil treats tumors in vivo in a tumor PDL1-dependent fashion. (A) ID8agg-luc tumor bioluminescence was measured in WT mice treated with chlorambucil (2 mg/kg) as described. N=5/group. P value, two-way ANOVA. (B, C) Kaplan-Maier survival curve in WT (B) or NSG mice (C) treated with chlorambucil 2 mg/kg as described. P value from log-rank test. N=5/group in WT mice and 6/group in NSG mice. (D) WT mice challenged with PDL1lo ID8agg cells and treated as described in (A). Mice body weight measured weekly and increase is relative to baseline. N=5 for PBS and six for chlorambucil, p value, two-way ANOVA. (E) Tumor growth of WT mice challenged with B16 cells and treated with 3 mg/kg chlorambucil, with the last treatment on day 18, N=5 for all groups. P value, two-way ANOVA. Kaplan-Maier survival curve in these WT mice (right panel). (F) Kaplan-Maier survival plot of NSG mice (N=5/group) challenged with B16 cells and treated with 3 mg/kg chlorambucil. (G) Tumor growth in WT mice challenged with PDL1KO B16 cells and treated with 3 mg/kg chlorambucil. N=5/group. (H) Tumor growth fold-change calculated as control treatment divided by chlorambucil treatment calculated separately for control and PDL1KO tumors on the given days shown. P value, χ2 test. (I) Kaplan-Maier survival curve of NSG mice challenged with PDL1KO B16 cells and treated with chlorambucil as in (G). N=5/group. (J) Tumor bioluminescence of PDL1KO mice challenged with ID8agg-luc cells and treated as in (A). N=6/group. P value, two-way ANOVA. (K) Kaplan-Maier survival curve of PDL1KO mice challenged with B16 cells and treated as described in (E). N=4 for both PBS and CAMB. ANOVA, analysis of variance; CAMB, chlorambucil; PBS, phosphate-buffered saline.

