FIGURE 1.

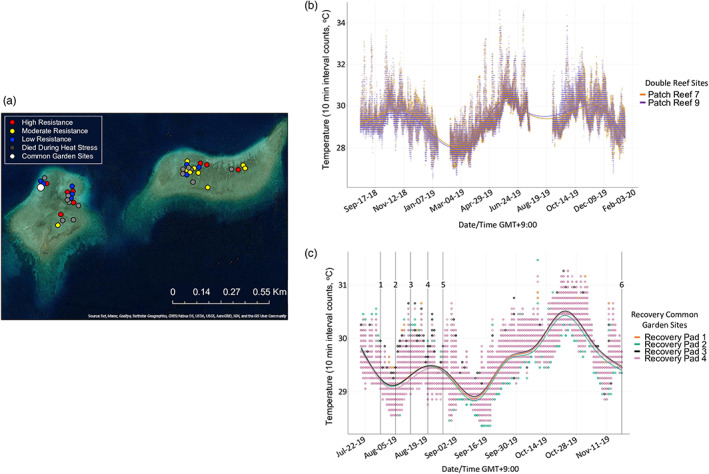
Geographic distribution of all coral colonies and temperature data. (a) ArcGIS‐generated map of double reef, located in the southern lagoon of Palau. The two patch reef sections were labeled patch reef 7 (on the righthand side, approximately N 7.29190 E 134.51034) and patch reef 9 (on the left, approximately N 7.29045 E 134.50325) in a previous widespread heat resistance mapping study (Cornwell et al., 2021). All corals were located within 1.5 km of each other, and each heat resistance category (high, moderate, and low) was represented on each patch reef, as well as corals that died during the heat stress experiment. The 6‐month recovery common garden experiment took place on patch reef 9 (N 7.29106, E 134.50215). (b) Timeseries plot of patch reef 7 and 9 temperature data 1 year prior to colony collection and during the recovery experiment period (August 19, 2018–January 20, 2020). We did not have available reef temperature data on January 19–February 10, 2019, July 18–August 30, 2019, or January 21–29 2020. (c) Timeseries plot of the 4 common garden concrete pads during 4 months of the recovery experiment (July 20, 2018–November 18, 2019). The plot includes vertical lines to highlight data collection timepoints: 1, recovery Day 0 (i.e., common garden deployment); 2, recovery Week 1; 3, recovery Week 2; 4, recovery Week 3; 5, recovery Month 1; 6, recovery Month 4. Temperature data at the common garden sites were unavailable during months 4–6 of the recovery period (November 19, 2019–January 29, 2020).
