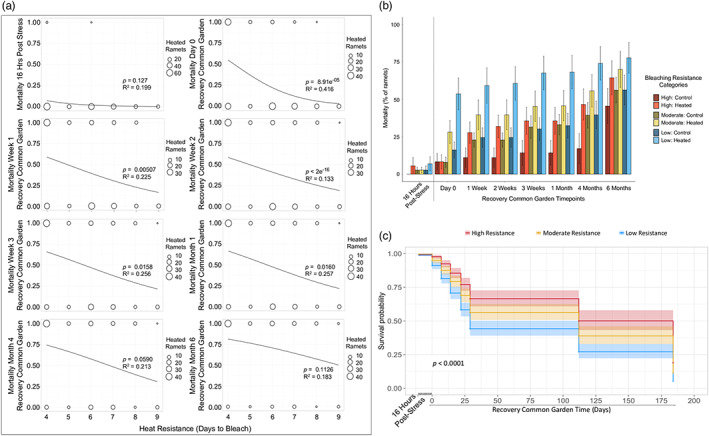
FIGURE 3.

Mortality during the recovery common garden experiment, based on heat resistance. (a) Binomial plot of alive (value = 0) and dead (value = 1) heat‐stressed ramets at all postheat stress timepoints, in which heat resistance is grouped by number of days to bleach in the heat stress experiment (4–9 days) and circle sizes represent ramet sample size per group. Summarized statistical results from binomial linear mixed effects models evaluating the relationship between heat resistance and mortality are provided for each timepoint (Appendix S2). (b) Barplots showing the average (±SE) percentage of mortality across all heat‐stressed and control ramets, at the 16 h postheat stress timepoint (to the left of the black dotted line) and all available recovery common garden timepoints, grouped by broad heat resistance categories: Low (4 days to bleach), moderate (5–6 days), and high (7–9 days). (c) Heated ramet survival curves for the three broad heat resistance categories, beginning at the 16 h postheat stress timepoint and then through the common garden recovery experiment. The following timepoints are included: 16 h postheat stress, and common garden Day 0, Day 7 (Week 1), Day 14 (Week 2), Day 22 (Week 3), Day 29 (Month 1), Day 112 (Month 4), and Day 184 (Month 6). Survival probabilities were generated for each heat resistance category, based on the Cox proportional hazards model (Appendix S2).
