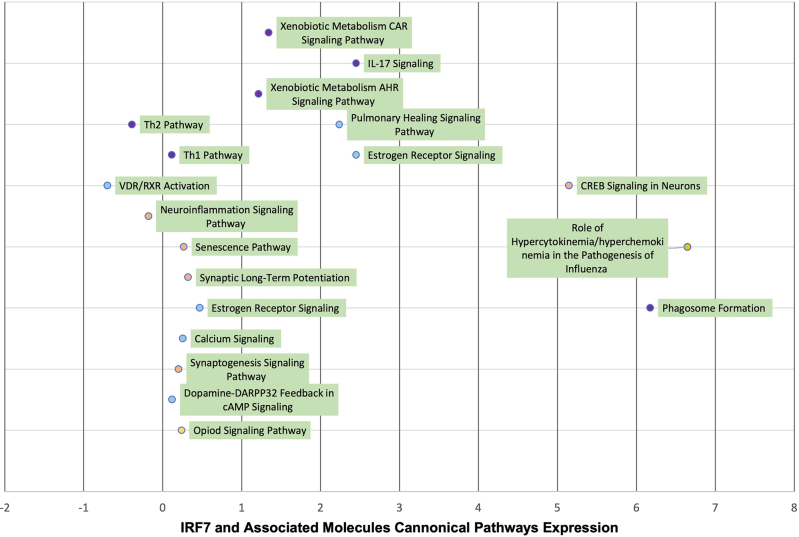
Figure 6:
Visual illustration of the quantitative analysis on the relationship between the 60 overlapping molecules between the molecules associated with IRF7 and the differential expression between F344 Saline and HIV-1Tg rats in the GSE47474 dataset. The significant canonical pathways (Z-score >/=+/−2) in the core analyses with IRF7 and its associated molecules were identified, and their corresponding Z-scores were identified. Likewise, the Z-scores of the same canonical pathways in the datasets without IRF7 and its associated molecules were identified. The above figure lists the difference in the Z-scores with and without IRF7 and its associated molecules to determine the changes brought upon by IRF7 and its associated molecules.

