. 2015 May;135(5):e1157–e1162. doi: 10.1542/peds.2014-3554

FIGURE 1.

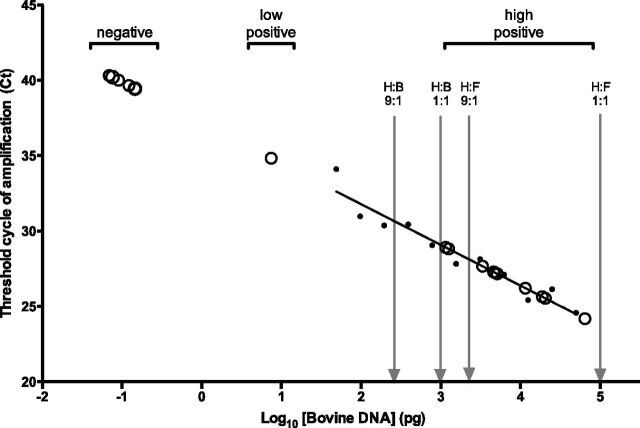
FIGURE 1. Quantification of bovine DNA. The black dots represent a twofold dilution series of total DNA extracted from cow’s milk. The solid black line represents the best-fit line and indicates a linear relationship between amplification threshold cycle (Ct) and log10 concentration of bovine DNA. Vertical gray lines indicate the amount of bovine DNA (log10) obtained after mixing reconstituted formula (F) or bovine milk (B) with human breast milk (H), at the indicated ratios (vol:vol). Ct values from 8 bovine-negative and 11 bovine-positive Internet samples are plotted as open circles.

Quantification of bovine DNA. The black dots represent a twofold dilution series of total DNA extracted from cow’s milk. The solid black line represents the best-fit line and indicates a linear relationship between amplification threshold cycle (Ct) and log10 concentration of bovine DNA. Vertical gray lines indicate the amount of bovine DNA (log10) obtained after mixing reconstituted formula (F) or bovine milk (B) with human breast milk (H), at the indicated ratios (vol:vol). Ct values from 8 bovine-negative and 11 bovine-positive Internet samples are plotted as open circles.