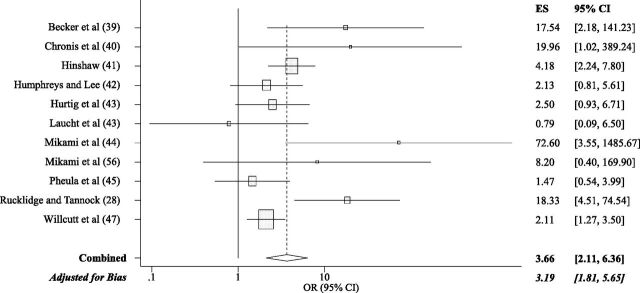
FIGURE 4.
Forest plot graphing ORs for anxiety among girls with versus without ADHD. Each study is represented by 1 horizontal line and box, with location of the box on the x-axis corresponding to the point estimate for each study, and the size of the box indicating the weight (inverse of variance) of the study. The diamond and dotted vertical line depict the overall effect estimate for all 11 studies, with the width of the diamond representing the CI.

