. 2015 Sep;136(3):466–478. doi: 10.1542/peds.2015-0359

FIGURE 4.

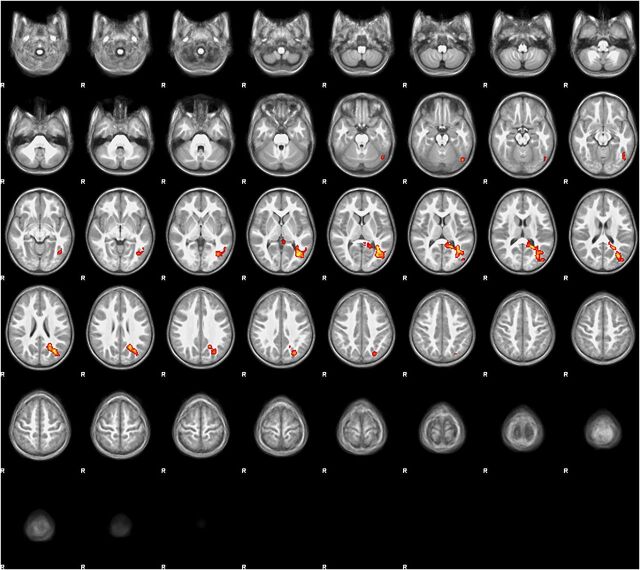
FIGURE 4. Regression map (stories > tones activation) with StimQ-P Reading subscale score as explanatory variable, controlling for household income. Regression map for the story listening task (stories > tones) in 3- to 5-year-old children (N = 19), with StimQ-P Reading score as explanatory variable, controlling for household income. Cluster size 2467 voxels significant at P < .05 (FDR corrected), z score local maxima 3.15 to 3.38. Five-millimeter slices from z = –28 to z = 74 in MNI coordinate space. Color scale from t = 1.25 (cooler) to 4 (hotter). Radiologic orientation, left = right, right = left.

Regression map (stories > tones activation) with StimQ-P Reading subscale score as explanatory variable, controlling for household income. Regression map for the story listening task (stories > tones) in 3- to 5-year-old children (N = 19), with StimQ-P Reading score as explanatory variable, controlling for household income. Cluster size 2467 voxels significant at P < .05 (FDR corrected), z score local maxima 3.15 to 3.38. Five-millimeter slices from z = –28 to z = 74 in MNI coordinate space. Color scale from t = 1.25 (cooler) to 4 (hotter). Radiologic orientation, left = right, right = left.