
Figure 4.
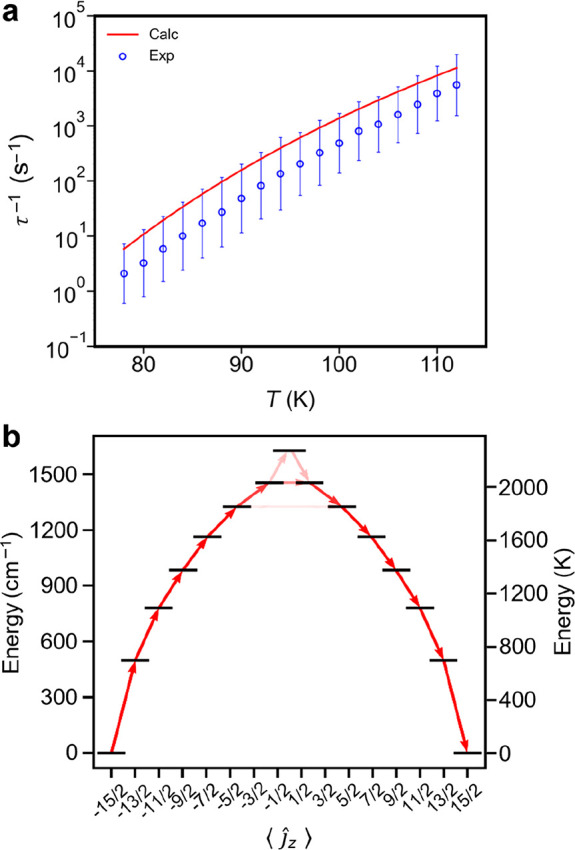
(a) Temperature dependence of calculated (red line, FWHM = 10 cm–1, 1-PBE) and experimental (blue symbols) relaxation rates. Error bars are 1σ estimated standard deviations determined from the generalized Debye model.15 (b) Electronic states of the eight Kramers doublets of the ground 6H15/2 multiplet of 1-PBE. Red arrows represent relaxation pathways, where the opacity of each arrow is proportional to the normalized spin-phonon transition probability.