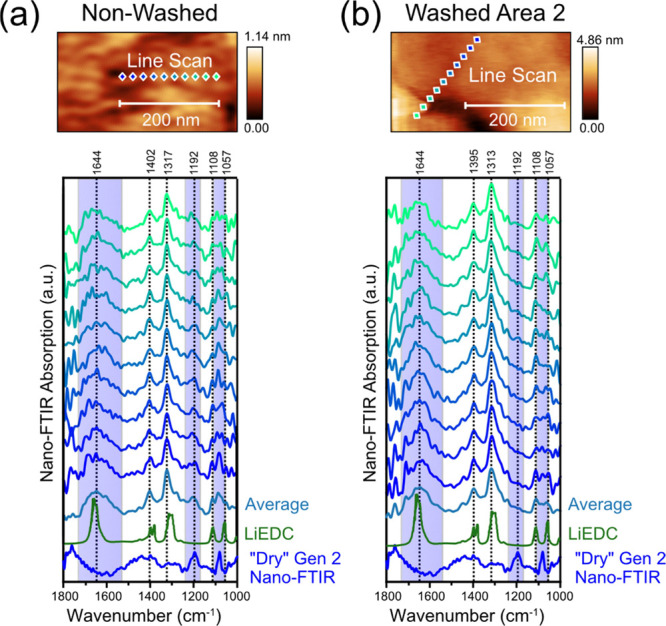
Figure 5.

AFM topography images and high-resolution nano-FTIR spectra of the (a) non-washed and (b) washed a-Si electrode after the 5 CV cycles and 12 h hold at 0.05 V. “Dry” Gen 2 electrolyte spectrum and lithium ethylene dicarbonate (LiEDC) spectrum from ref (36).
