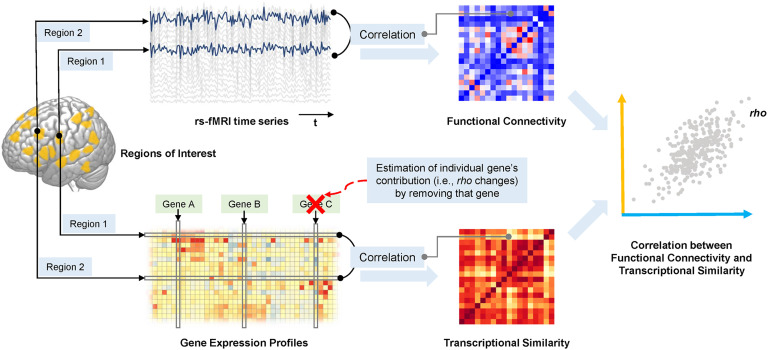
Figure 1. .
Schematic of the pipeline for computing the correlation between resting-state functional connectivity and transcriptomic similarity within a network of regions first defined according to task fMRI data. Regional time series from rs-fMRI were used to estimate functional connectivity between each pair of regions (in the upper matrix, red indicates stronger functional connectivity and blue indicates weaker functional connectivity). Regional gene expression profiles were applied to estimate inter-regional transcriptional similarity (in the lower matrix, red indicates higher similarity and yellow indicates lower similarity; lower panel). Resting-state functional connectivity patterns (orange axis in the right-hand panel) are correlated with patterns of transcriptional similarity (blue axis in the right-hand panel). Each gene’s contribution to this correlation is estimated by removing that gene at the step of gene expression network construction (red cross) and repeating the subsequent analysis.

