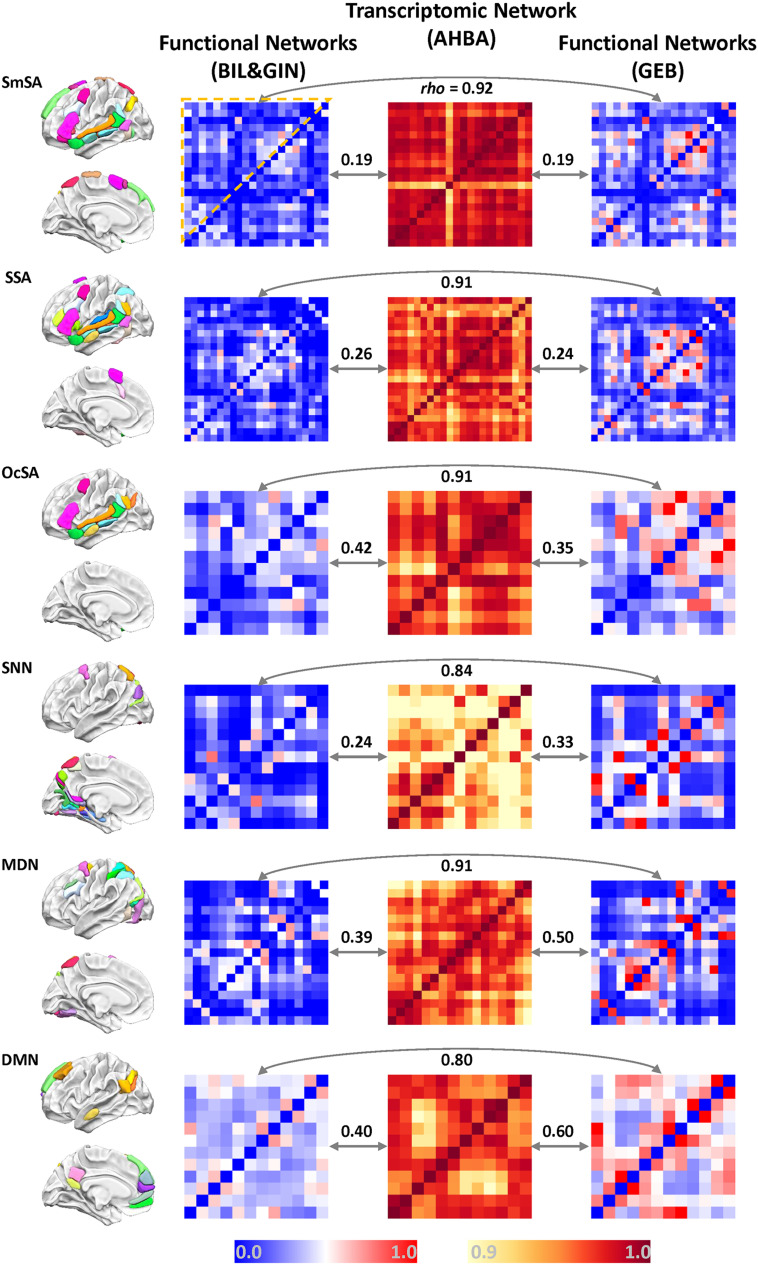
Figure 2. .
Functional and transcriptomic networks of the present study. First (left-side) column: the sets of cortical regions defined based on task fMRI data; the top three (SmSA, SSA, and OcSA) correspond to the three different ways of defining the network for sentence processing, and the bottom three correspond to the three other comparison networks. Second and fourth columns: the functional connectivity networks based on rs-fMRI from the BIL&GIN data set and GEB data set, respectively. Third column: the transcriptomic networks based on the AHBA database. Within each matrix, the colors indicate the strength of pairwise inter-regional correlations or transcriptomic inter-regional similarity. Correlation values among the right three columns are the Spearman correlations (rho) of each pair of matrices for a given network, based on the upper triangle part of each matrix. All correlations were significant (p < 0.01). SmSA, Supramodal Sentence Area; SSA, Synthesized Sentence Area; OcSA, One-contrast Sentence Area; SNN, Spatial Navigation Network; MDN, Multiple Demands Network; DMN, Default Mode Network.

