

ABSTRACT
Background
Immunoglobulin A nephropathy (IgAN) and its systemic variant IgA vasculitis (IgAV) damage the glomeruli, resulting in proteinuria, hematuria and kidney impairment. Dendrin is a podocyte-specific protein suggested to be involved in the pathogenesis of IgAN. Upon cell injury, dendrin translocates from the slit diaphragm to the nucleus, where it is suggested to induce apoptosis and cytoskeletal changes, resulting in proteinuria and accelerated disease progression in mice. Here we investigated gene and protein expression of dendrin in relation to clinical and histopathological findings to further elucidate its role in IgAN/IgAV.
Methods
Glomerular gene expression was measured using microarray on 30 IgAN/IgAV patients, 5 patients with membranous nephropathy (MN) and 20 deceased kidney donors. Dendrin was spatially evaluated on kidney tissue sections by immunofluorescence (IF) staining (IgAN patients, n = 4; nephrectomized kidneys, n = 3) and semi-quantified by immunogold electron microscopy (IgAN/IgAV patients, n = 21; MN, n = 5; living kidney donors, n = 6). Histopathological grading was performed according to the Oxford and Banff classifications. Clinical data were collected at the time of biopsy and follow-up.
Results
Dendrin mRNA levels were higher (P = .01) in IgAN patients compared with MN patients and controls and most prominently in patients with preserved kidney function and fewer chronic histopathological changes. Whereas IF staining did not differ between groups, immunoelectron microscopy revealed that a higher relative nuclear dendrin concentration in IgAN patients was associated with a slower annual progression rate and milder histopathological changes.
Conclusion
Dendrin messenger RNA levels and relative nuclear protein concentrations are increased and associated with a more benign phenotype and progression in IgAN/IgAV patients.
Keywords: chronic kidney disease, dendrin, IgA nephropathy, immunoelectron microscopy, microarray
KEY LEARNING POINTS.
What is already known about this subject?
Immunoglobulin A nephropathy (IgAN) is the most common primary glomerulonephritis, characterized by proteinuria, glomerulosclerosis and decline of kidney function.
Dendrin has been detected in podocyte nuclei in biopsies from IgAN patients.
In animal models, dendrin is suggested to induce podocyte apoptosis and rearrangement of cytoskeleton, causing proteinuria, glomerulosclerosis and a decline of kidney function, but our understanding of the pathogenic link between dendrin and human IgAN has been poor, requiring extended studies in this area.
What this study adds?
Although we report a positive association between glomerular dendrin gene expression and IgAN, dendrin podocyte protein concentration is not significantly elevated compared with healthy controls, suggesting a nonlinear relation between dendrin RNA and protein concentrations in IgAN.
Patient subgroups were identified presenting with mild disease manifestations, both in terms of clinical and histopathological parameters and relatively higher dendrin protein nuclear concentrations.
Dendrin captures differences in disease manifestations in patients with IgAN.
What impact this may have on practice or policy?
Dendrin should be looked upon as a biomarker associated with better clinical outcome in IgAN.
As a biomarker, dendrin could be used as a complement to the traditional classification of IgAN to stratify patients into molecular subgroups, thus contributing to better phenotyping and precision medicine development.
INTRODUCTION
Immunoglobulin A nephropathy (IgAN) is the most common glomerulonephritis globally and one of the leading causes of kidney failure (KF). IgAN, mainly affecting young adults, is characterized by proteinuria and hematuria leading to a successive loss of kidney function. Approximately 25–30% will reach KF within 20 years from diagnosis [1], but the clinical picture and progression rate vary widely. IgA vasculitis (IgAV; formerly Henoch–Schönlein purpura) is a systemic variant of IgAN, defined as a small-vessel vasculitis with IgA-dominant immune deposits. Typically the skin, gut and joints are affected. The kidney symptoms and the histopathological picture are indistinguishable from that of IgAN [2].
As both the histopathological findings and the clinical course of IgAN/IgAV vary, it is important to identify patients with a high risk of disease progression. Persistent proteinuria (>1 g/day) and high blood pressure are factors associated with a rapid decline of kidney function [3]. Histopathologically, a set of specific morphological parameters, referred to as the Oxford classification scoring system (MEST-C), is used to predict disease progression in IgAN. The four classification markers are mesangial hypercellularity (M), endocapillary hypercellularity (E), segmental glomerulosclerosis (S) and tubular atrophy/interstitial fibrosis (T) [4, 5]. The presence of crescents (C) was added to the scoring system in 2016 [6, 7].
Dendrin is an 81-kDa protein that under normal conditions localizes at the podocyte slit diaphragm (SD) where dendrin physically associates with the structural proteins nephrin [8] and CD2AP [9], an adaptor protein known to suppress pro-apoptotic transforming growth factor (TGF)-β signaling [10]. Whereas dendrin's role at the SD remains to be unraveled, experimental studies have revealed that glomerular injury causes dendrin to translocate to the podocyte nucleus where it seems to activate apoptosis and rearrangement of the cytoskeleton [9, 11]. Podocyte apoptosis leads to podocytopenia and subsequently to segmental and global glomerulosclerosis [12, 13], which are associated with poor outcomes in several glomerular diseases [14].
In IgAN, the degree of podocyte loss correlates with the extent of glomerulosclerosis and disease severity [15]. Dendrin has previously been detected in podocyte nuclei in IgAN biopsies [16, 17], but whether it influences IgAN disease progression is unclear. Inhibition of dendrin in a mouse model of progressive glomerulosclerosis resulted in less glomerulosclerosis, milder proteinuria and delayed onset of KF [18], suggesting dendrin to be causatively linked to glomerulosclerosis and proteinuria development. However, as data from patients with minimal change disease (MCD), a kidney disease predominantly characterized by proteinuria but not glomerulosclerosis, showed that dendrin podocyte concentrations were not different to those of control subjects [19], dendrin appears to be more related to the development of glomerulosclerosis than to proteinuria.
The aim of our study was to investigate dendrin in relation to histopathological and clinical findings, including segmental and global glomerulosclerosis, proteinuria and disease progression in IgAN/IgAV. For comparison, control material from kidney donors and biopsy material from patients with membranous nephropathy (MN) were used, the latter as MN is typically associated with massive proteinuria and impaired glomerular filtration rate (GFR), but less commonly segmental sclerotic lesions in the glomeruli.
MATERIALS AND METHODS
Patients
Study inclusion criteria were clinical symptoms of IgAN/IgAV or MN, diagnostic kidney biopsy and histopathologically verified IgAN/IgAV or MN. A brief description of clinical parameters in patients included in the microarray and immunoelectron microscopy (iEM) analyses is presented in Tables 1 and 2. In the microarray analysis, 30 patients with biopsy-verified IgAN/IgAV at either Karolinska University Hospital (K) or Sahlgrenska University Hospital (SU) were enrolled. The group with IgA nephropathies consisted of 17 males and 13 females, the median age was 40 years (range 23–69) and the median estimated GFR (eGFR) was 74 ml/min/1.73 m2 (range 19–123). Five MN patients were included (two males and three females, all from K) and had a median age of 69 years (range 59–74) and a median eGFR of 74 ml/min/1.73 m2 (range 26–97). Twenty deceased kidney donors [10 males, median age 54 years (range 28–72)] were included at SU as controls.
Table 1.
Baseline characteristics of patients and controls—microarray cohort
| Characteristics | IgAN patients (n = 30) | MN patients (n = 5) | Controls (n = 20) | P-value |
|---|---|---|---|---|
| Age (years), median (range) | 40 (23–69) | 69 (59–74) | 54 (28–72) | .001 |
| Sex (male/female), n/n | 17/13 | 2/3 | 10/10 | .75 |
| BP medication (yes/no), n/n | 18/12 | 4/0a | UNK | .12 |
| RAASi (yes/no), n/n | 17/13 | 5/0 | UNK | .13 |
| UACR (mg/mmol), median (range) | 115 (0.6–560)b | 726 (172–910) | UNK | .003 |
| Hematuria (yes/no), n/n | 27/3 | 5/0 | UNK | 1.00 |
| p-Creatinine (μmol/L), median (range) | 93 (56–333) | 93 (57–169) | UNK | .98 |
| eGFRc (ml/min), median (range) | 74 (19–123) | 74 (26–97) | UNK | .49 |
| CKD stage (1/2/3/4/5), n | 8/15/4/3/0 | 1/2/2/0/0 | NA | .49 |
Statistical comparisons between IgAN, MN and controls were performed with the Kruskal–Wallis test. Comparisons between IgAN and MN was performed with the Wilcoxon rank sum test. Nominal variables were analyzed using Pearson's chi-squared test.
aData presented in 4/5 patients.
bData presented in 29/30 IgAN patients.
ceGFR is estimated using the CKD-EPI equation.
BP, blood pressure; NA, not applicable; RAASi, renin–angiotensin–aldosterone-system inhibitor; UNK, unknown.
Table 2.
Baseline characteristics of patients and controls—iEM cohort
| Characteristics | IgAN patients (n = 21) | MN patients (n = 5) | Living donors (n = 6) | P-value |
|---|---|---|---|---|
| Age (years), median (range) | 31 (8–57) | 59 (35–70) | 46 (42–63) | .04 |
| Sex (male/female), n/n | 19/2 | 1/4 | 1/5 | <.0002 |
| BP medication (yes/no), n/n | 15/5a | 4/1 | UNK | .87 |
| RAASi (yes/no), n/n | 11/9a | 3/2 | UNK | .00 |
| UACR (mg/mmol), median (range) | 158 (10–683)b | 386 (257–1254) | UNK | .03 |
| Hematuria (yes/no), n/n | 20/1 | 4/1 | UNK | .35 |
| p-Creatinine (μmol/L), median (range) | 106 (61–239)c | 64 (57–169) | 73 (58–79) | .02c |
| eGFR (ml/mind), median (range), n | 75 (26–130) | 88 (23–94) | 82 (73–98) | .61 |
| CKD stage (1/2/3/4/5), n | 7/8/3/3/0 | 2/1/1/1/0 | NA | .90 |
Statistical comparisons between IgAN, MN and control groups performed with the Kruskal–Wallis test. Comparison between IgAN and MN was performed with the Wilcoxon rank sum test. Nominal variables were analyzed using Pearson's chi-squared test.
aData shown for 20/21 patients.
bData shown for 19/21 patients.
cData shown only for adult patients (IgAN patients, n = 17).
deGFR estimated using the Lund–Malmö formula.
The four biopsies used for immunofluorescence (IF) came from three males and one female [median age 50 years (range 36–75), median eGFR 40 ml/min/1.73 m2(range 7–64)]. Macroscopically unaffected tissue from three nephrectomies, which were performed due to urologic cancer, were used as controls. All these were enrolled at K.
The iEM cohort consisted of 21 patients with IgAN/IgAV, 19 males and 2 females [median age 31 years (range 8–57), median eGFR 75 ml/min/1.73 m2 (range 26–130)]. These patients were chosen so that all parameters in the Oxford score, different ranges of albuminuria as well as different stages of chronic kidney disease (CKD) and progress of disease were represented. For comparison, five patients with MN [one male, median age 59 years (range 35–70), median eGFR 88 ml/min/1.73 m2 (range 23–94)] as well as six living donors [one male, median age 46 years (range 42–63), median eGFR 82 ml/min/1.73 m2 (range 73–98)] were included. All patients and controls in the iEM cohort were enrolled at K.
Histopathological evaluation
The histopathological diagnosis was based on light microscopy (stained with hematoxylin and eosin, periodic acid–Schiff, Ladewig trichrome and periodic acid–silver) in combination with IF and electron microscopy findings. From the biopsies in the iEM cohort, small pieces of the biopsy material were saved and embedded in a low-temperature resin (K11M) and analyzed with iEM. All biopsies were reexamined to confirm the diagnosis. Biopsies from IgAN patients were further evaluated according to the Oxford classification scoring system [4, 5, 7]. The degree of inflammation and vascular changes (intimal fibrosis in arteries and arteriolar hyalinosis) were semiquantified using the Banff classification, system [20] in both IgAN and IgAV patients. Since the Oxford classification system is not yet validated in IgAV, biopsies from IgAV patients were only evaluated according to the Banff classification system as mentioned above. The degree of global glomerulosclerosis was also estimated as a percentage of the total number of glomeruli. Histopathological evaluation and semiquantification were performed by two experienced renal pathologists (A.W. and J.M.).
Clinical variables
Clinical data were obtained from the patient files. The Chronic Kidney Disease Epidemiology Collaboration (CKD-EPI) equation [21] was used to calculate eGFR in the IF and the microarray cohort, but without modifying for race. In the iEM cohort, eGFR was derived from the Lund–Malmö (LM) equation [22], as this formula has been found to show high accuracy in children [23].
IgAN patients in the microarray and iEM cohorts were followed prospectively for up to 19 years (median follow-up 7 years). Follow-up ended when reaching KF (9 of 51 patients). Plasma creatinine measurements at the annual follow-up were used to estimate GFR. By estimating annual GFR, a mean loss of kidney function per year could be assessed, i.e. Δ-GFR.
The study protocol was approved by the Swedish Ethical Review Authority and the study was conducted according to the Declaration of Helsinki.
Microarray
Microdissection and RNA isolation
The tissue was placed and stored in RNAlater (Qiagen, Venlo, The Netherlands) immediately after the biopsy procedure. Glomeruli were microdissected by hand and total RNA was extracted using an RNeasy Mini Kit (Qiagen).
Microarray analysis of glomerular tissue
Conversion to complementary DNA was performed using the Ovation Pico WTA system (NuGen, San Carlos, CA, USA). Hybridization, washing and staining was carried out on GeneChip HGU133 Plus 2.0 platform using a GeneChip Fluidics Station 450 (Affymetrix, Santa Clara, CA, USA), according to the manufacturer's protocol. The fluorescence intensities were determined with a GeneChip Scanner 3000 7G and analyzed using the GeneChip operating software (Affymetrix) and expression console.
Bioinformatics
Raw data were normalized using the Bioconductor gcrma package (version 2.32.0), and significance analysis of microarrays was performed to identify the significantly differentially expressed genes (Bioconductor siggenes package, version 1.34.0).
IF
Antibodies
Primary polyclonal antibodies against dendrin (host: rabbit) and nephrin (host: mouse) were previously generated in-house by Patrakka et al. [24] and Hoechst 33342 (Thermo Fisher Scientific, Waltham, MA, USA) was used as a nuclear stain.
Preparation and staining
Biopsies from patients and controls were embedded in OCT cryomount (Histolab #45830, Askim, Norway), snap frozen and cut in 4-μm thick sections. Sections were thawed and washed with phosphate buffer saline (PBS) at room temperature (RT), then fixed at −20°C in aceton and thereafter blocked with 5% normal goat serum (NGS) (Gibco #PCN5000, Waltham, MA, USA) in PBS at RT. The sections were then incubated overnight with antidendrin antibody in 0.5% NGS PBS solution at 4°C and for 45 min at RT with secondary anti-rabbit Alexa Fluor 488 (Invitrogen, Waltham, MA, USA) antibody. Antinephrin antibody was added to the sections in 0.5% NGS PBS solution for 3 h at RT and followed by secondary antibody anti-mouse Alexa Fluor 546 for 45 min at RT. Before the last washing step, the sections were incubated with Hoechst 33342 dye against double-stranded DNA and then mounted with Aqua Mount (Thermo Fisher Scientific #TA-125-AM). All in-between washing steps were done with PBS. Confocal microscopy was performed using a Leica SP8 (Leica Microsystems, Deerfield, IL, USA).
iEM
Antibody
Polyclonal antibody against dendrin produced by Patrakka et al. [24] was used for iEM.
Preparation and staining
Kidney biopsies were dehydrated at low temperature in methanol and embedded in Lowicryl K11M (Chemische Werke Lowi, Waldkraiburg, Germany). Ultrathin sections were mounted on carbon/formvar nickel grids and incubated in 2% bovine serum albumin (BSA) and 2% gelatin in 0.1 M phosphate buffer (PB) at pH 7.4, followed by incubation overnight with polyclonal antibody against dendrin as previously described by Patrakka et al. [24]. Bound antibodies were detected by gold-conjugated protein A (Biocell Laboratories, Rancho Dominguez, CA, USA), diluted 1:100 in 0.1M PB containing 0.1% BSA and 0.1% gelatin (PBBG).
Semiquantification of dendrin expression in podocytes
Sections were examined on a Tecnai 10 microscope (FEI Eindhoven, The Netherlands) and digital images were taken with a Veleta camera (SiS, Münster, Germany). A cumulative mean plot indicated that 10 images were needed from each compartment in the glomerulus, but up to 30 images were taken from the podocyte nuclei. The corresponding cytoplasm was chosen in a random systematic sampling procedure at low magnification along the glomerular capillaries. Prints at a final magnification of 43 000× were examined and the number of gold (Au) markers in the podocyte nuclei and cytoplasm was counted. The area of corresponding compartment was calculated by point counting, using a 1.5×1.5 cm square lattice [25] and expressed as μm2. The dendrin concentration (Au/μm2) was calculated by dividing the total number of Au particles with the area. Since dendrin under normal conditions is located in the foot processes, a line was drawn in the cytoplasm, 1 μm from the glomerular basal membrane (GBM). Au particles within this area were counted separately to assess dendrin concentration in the so-called foot process area (FPA). To avoid false differences in dendrin concentrations between samples due to technical issues, the nuclei concentrations were normalized to the concentration in the cytoplasm, resulting in two different ratios: nuclear/cytoplasm (n/cyt) and nuclear/FPA (n/FPA). An illustration of how the podocytes were divided into different compartments is shown in Figure 1.
FIGURE 1:
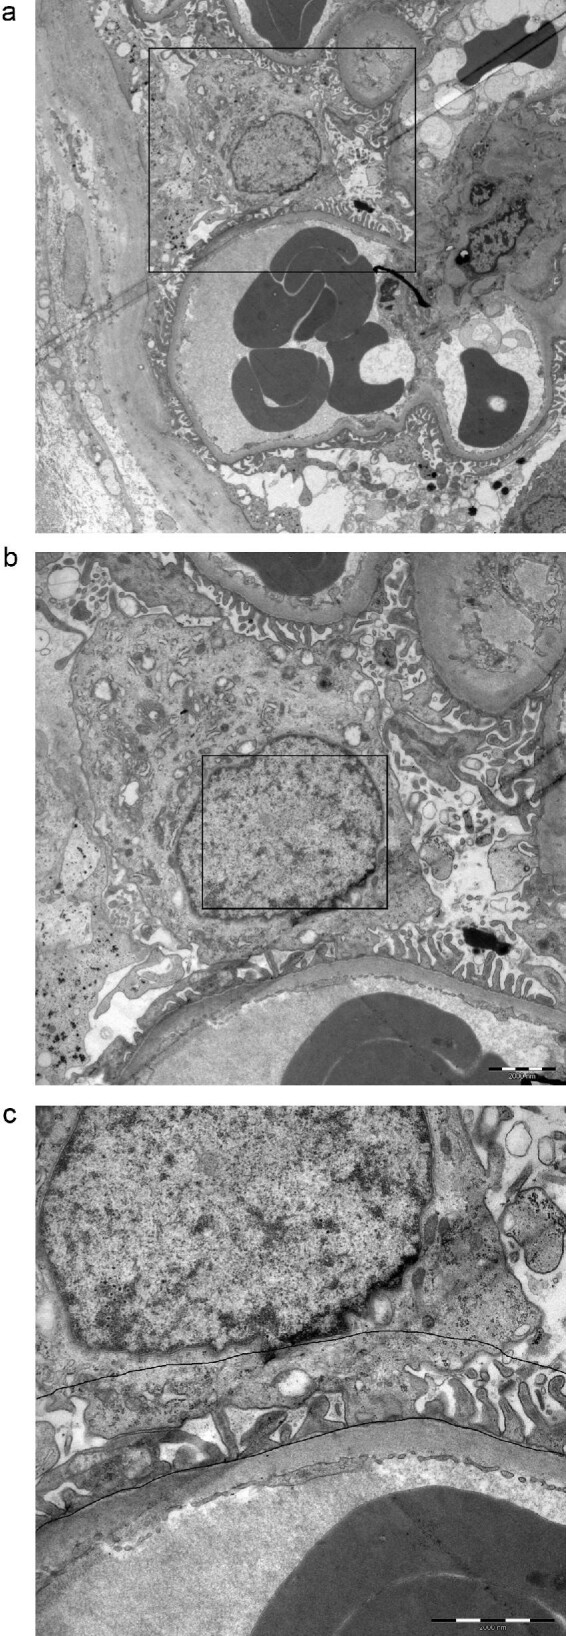
Schematic illustrating how the immunoelectron microscopy sampling procedure was performed. (a) Overview of a podocyte, (b) the podocyte nucleus and (c) the podocyte foot processes. A line was drawn 1 μm from the glomerular basal membrane in the cytoplasm, the so-called FPA.
Statistics
Testing for a normal distribution was conducted with the Shapiro–Wilk test. The Mann–Whitney U test, Fisher's exact test or Kruskal–Wallis one-way analysis of variance was used to evaluate differences between groups. Spearman's rank correlation was used to evaluate correlations and Fisher’s exact test/chi-squared test was used when comparing categorical variables. P-values <.05 were considered statistically significant. Statistical analyses were performed using JMP version 14.1.0 (JMP, Cary, NC, USA), SPSS Statistics version 26.0.0.0 (IBM, Armonk, NY, USA) or GraphPad Prism version 9.0.0 (GraphPad Software, San Diego, CA, USA).
RESULTS
Patient disposition
Patient and control characteristics for the microarray cohort and iEM groups are shown in Tables 1 and 2 and Supplemental data, Tables 1a and 1b, respectively. In both cohorts there was a statistical age difference between groups (P = .001 and P = .04), where the IgAN/IgAV patients were younger than the MN patients and controls. In the iEM cohort, sex distribution differed between groups (P < .0002), with a larger proportion of men among the IgAN/IgAV patients compared with MN patients and controls. This was not observed between groups in the microarray cohort. In both cohorts, MN patients had significantly more proteinuria compared with IgAN patients (P = .003 microarray and P = .03 iEM, respectively). In the microarray group, all MN patients (data missing in 1 case) and 18 IgAN/IgAV patients were treated with antihypertensive drugs (Table 1), whereas 15 IgAN/IgAV patients (data missing in 1 case) as well as 4 MN patients were on antihypertensive treatment in the iEM group (Table 2).
Dendrin gene expression in glomerular tissue
The gene expression of dendrin (DDN, normalized) was significantly higher in IgAN/IgAV patients compared with deceased donors (P = .01, Figure 2a). In contrast, there was no difference between MN patients and deceased donors in DDN expression. The IgAN/IgAV group demonstrated a wide distribution of the DDN fold change. DDN expression in relation to clinical features is presented in Table 3. DDN expression was not associated with sex and did not correlate to age, creatinine, urine albumin:creatinine ratio (UACR) or global glomerulosclerosis (Table 3). Low expression of DDN at the time of biopsy was evident in the more severe CKD classes, as shown in Figure 3a, but longitudinal data showed no association between DDN expression and ∆GFR (Table 3). However, lower DDN expression was associated with a poor 5-year prognosis, defined as doubling of creatinine, 50% reduction of eGFR or start of dialysis or transplantation within 5 years (Figure 3c), partly explained by the fact that patients with a poor 5-year prognosis had a significantly lower eGFR at baseline. When stratifying IgAN patients according to Oxford classification scores (Table 4), we found that IgAN patients with segmental sclerosis (S1) had significantly lower DDN expression (P = .03).
FIGURE 2:

Dendrin gene expression but not protein levels are higher in IgAN/IgAV kidneys. (a) Dendrin gene expression measured by microarray in IgAN/IgAV patients (n = 30), MN patients (n = 5) and controls (n = 20). Dunn's test revealed a significant difference between IgA and controls (P = .007). There was no significant difference between IgAN and MN patients or between MN patients and controls. (b) Total dendrin protein concentration evaluated with iEM in IgAN/IgAV patients (n = 21), MN patients (n = 5) and controls (n = 6). Statistical differences between groups were analyzed with the Kruskal–Wallis and Dunn's test.
Table 3.
Univariate correlations between dendrin gene expression and clinical variables in IgAN/IgAV patients (n = 30)
| Variable | ρ | P-value |
|---|---|---|
| Age (years) | −0.02 | .93 |
| Creatinine (μmol/L) | 0.06 | .77 |
| UACRa (mg/mmol) | 0.12 | .55 |
| eGFRb (ml/min) | 0.07 | .71 |
| ∆GFRa (ml/min/year) | 0.21 | .28 |
| Global glomerulosclerosis (%) | 0.004 | .99 |
Correlations analyzed using the Spearman rank test. aData shown for 29/30 patients. beGFR estimated using the CKD-EPI formula.
FIGURE 3:

Dendrin gene expression and protein levels in relation to CKD stage and prognosis in IgAN/IgAV patients. (a) Dendrin gene expression in patients with CKD stage 1 (n = 8), 2 (n = 15), 3 (n = 4) and 4 (n = 3) (P = .009). (b) Total dendrin protein concentration by iEM and CKD stages. CKD stage 1 (n = 7), 2 (n = 8), 3 (n = 3), 4 (n = 3) and 5 (n = 0). (c) Dendrin gene expression and poor prognosis (poor prognosis: yes, n = 4; no, n = 20; (P = .03). (d) Total dendrin protein concentration by iEM and poor prognosis (poor prognosis: yes, n = 5; no, n = 16). Poor prognosis was defined as doubling of creatinine, 50% reduction of GFR or start of dialysis, or transplantation within 5 years. Statistical analyses were performed using the Kruskal–Wallis and Mann–Whitney U test.
Table 4.
Dendrin gene expression in IgAN patients (n = 23) stratified by Oxford classification scores
| Score | ||||
|---|---|---|---|---|
| Variable | 0 | 1 | 2 | P-value |
| M | 139.12 (7.61–9.42) | 108.68 (3.05–9.69) | .19 | |
| E | 199.09 (6.13–9.69) | 48.57 (3.05–9.42) | .51 | |
| S | 89.20 (8.51–9.42) | 158.71 (3.05–9.69) | .03 | |
| T | 149.11 (7.36–9.69) | 68.98 (8.71–9.32) | 36.13 (3.05–8.35) | .34a |
| C | 149.11 (7.36–9.39) | 98.71 (3.05–9.69) | 0 | .78 |
Values presented as median (range). Comparison between groups performed using the Mann–Whitney U test. aDue to the small sample size, T1 and T2 were merged into one group when performing statistical analysis.
Dendrin protein expression in glomeruli by IF
IF double staining against dendrin and nephrin confirmed dendrin's podocytic localization close to nephrin along the capillary loops. In control kidneys, the signal of both proteins overlapped. In IgA kidneys, it appeared at first, as if the dendrin and nephrin staining were of less intensity compared with controls. However, this was only seen in areas with damaged glomerular structure, whereas the signal intensity for dendrin was of equal intensity where the glomerular structure was retained. In these intact areas of the glomeruli, dendrin was found to a greater extent in the podocyte nuclei compared with nephrin (Figure 4, Supplementary data, Figure S1).
FIGURE 4:

IF staining against dendrin in human glomeruli of IgAN and controls shows intact staining along glomerular capillaries (arrows).
Dendrin protein expression in podocytic compartments using iEM
The overall dendrin protein concentration detected in podocytes did not differ between IgAN/IgAV patients, MN patients and living donors (Figure 2b). However, subgroups of IgAN/IgAV patients with the presence of M1, S1 or T1/T2 lesions had significantly lower relative nuclear dendrin concentrations compared with IgAN patients scoring M0 (nucleus relative to cytoplasm; Table 8), S0 (nucleus relative to foot processes and nucleus relative to cytoplasm; Tables 6 and 8) and T0 (nucleus relative to cytoplasm and nucleus relative to foot processes; Tables 6 and 8). In addition, total podocyte dendrin concentration was higher in patients with arteriolar hyalinosis, defined by the Banff classification, as shown in Table 11 (P = .03). Other histopathological markers according to the Oxford or Banff classification scores did not correlate to dendrin protein concentrations (Tables 6–11). Furthermore, dendrin protein concentrations were not associated with sex, did not differ between IgAN and IgAV patients and no correlations between dendrin protein concentrations and age or measurements of kidney function were found in univariate analyses (Table 5). However, significantly lower relative nuclear dendrin concentrations (nucleus relative to foot processes and nucleus relative to cytoplasm) were associated with a high annual progression rate, i.e. ∆GFR (Table 5).
Table 8.
Dendrin protein expression (nucleus/cytoplasm) in IgAN patients stratified by Oxford classification score
| Score | ||||
|---|---|---|---|---|
| Variable | 0 | 1 | 2 | P-value |
| M |
n = 8; 0.64 (0.22–0.88) |
n = 7; 0.41 (0.16–0.53) |
.05 | |
| E |
n = 13; 0.53 (0.16–0.88) |
n = 2; 0.35 (0.29–0.40) |
.31 | |
| S |
n = 5; 0.65 (0.53–0.88) |
n = 10; 0.41 (0.16–0.68) |
.02 | |
| T |
n = 7; 0.65 (0.40–0.88) |
n = 7; 0.29 (0.16–0.64) |
n = 1; 0.48 |
.03a |
| C |
n = 9; 0.59 (0.22–0.88) |
n = 6; 0.35 (0.16–0.68) |
n = 0 | .15 |
Relative dendrin concentration (nucleus/cytoplasm) is presented as median (range). Comparisons performed with the Mann–Whitney U test.
aComparison made between T0 and T1–T2 due to small sample size.
Table 6.
Dendrin protein concentration (nucleus/foot processes) in IgAN patients (n = 15) stratified by Oxford classification score
| Score | ||||
|---|---|---|---|---|
| Variable | 0 | 1 | 2 | P-value |
| M |
n = 8; 0.54 (0.18–0.71) |
n = 7; 0.39 (0.15–0.54) |
.07 | |
| E |
n = 13; 0.52 (0.15–0.71) |
n = 2; 0.35 (0.26–0.43) |
.35 | |
| S |
n = 5; 0.54 (0.52–0.71) |
n = 10; 0.39 (0.15–0.58) |
.01 | |
| T |
n = 7; 0.54 (0.39–0.71) |
n = 7; 0.26 (0.15–0.54) |
n = 1; 0.44 | .03a |
| C |
n = 9; 0.54 (0.18–0.71) |
n = 6; 0.35 (0.15–0.58) |
n = 0 | .16 |
Relative dendrin protein concentration (nucleus/foot processes) is presented as median (range). Comparison between groups performed using the Mann–Whitney U test.
aComparison made between T0 and T1–T2 due to small sample size.
Table 11.
Dendrin protein expression (total podocyte concentration) in IgAN/IgAV patients stratified by Banff classification system
| Score | |||||
|---|---|---|---|---|---|
| Variable | 0 | 1 | 2 | 3 | P-value |
| Inflammationa |
n = 11; 0.70 (0.38–1.52) |
n = 8; 0.94 (0.54–1.40) |
n = 1; 1.36 |
n = 0 | .15b |
| Intima fibrosisc |
n = 11; 0.70 (0.38–1.21) |
n = 3; 0.96 (0.85–1.40) |
n = 2; 0.65 (0.58–0.72) |
n = 3; 0.75 (0.54–1.36) |
.49d |
| Hyalinosisa |
n = 16; 0.71 (0.38–1.52) |
n = 2; 0.96 (0.93–1.36) |
n = 0 |
n = 1; 1.40 |
.03d |
Total protein dendrin concentration is presented as median (range). Comparisons are made with the Mann–Whitney U test or Kruskal–Wallis test. aData shown for 20/21 IgA patients.
bDue to small sample size, comparison was made between groups scoring 0 and groups scoring 1–2.
cData shown for 19/21 IgA patients.
dDue to small sample size, comparison was made between groups scoring 0 and groups scoring 1–3.
Table 5.
Univariate correlations between dendrin protein concentrations by iEM and clinical variables in IgAN/IgAV patients
| Nucleus/foot processes | Nucleus/cytoplasm | Total cell | ||||
|---|---|---|---|---|---|---|
| Variable | ρ | P-value | ρ | P-value | ρ | P-value |
| Age (years) | 0.01 | .95 | −0.03 | .89 | −0.001 | .10 |
| p-Creatinine (μmol/L) | −0.16 | .50 | −0.20 | .38 | −0.03 | .89 |
| UACR (mg/mmol)a | −0.12 | .62 | −0.04 | .86 | 0.10 | .69 |
| eGFR (ml/min)b | 0.20 | .39 | 0.22 | .33 | −0.04 | .86 |
| ∆GFR (ml/min/year)c | 0.46 | .04 | 0.55 | .01 | −0.17 | .47 |
| Global sclerosis (%) | −0.16 | .51 | −0.20 | .39 | 0.06 | .80 |
Correlations analyzed using the Spearman rank test.
aData presented for 19/21 patients.
beGFR estimated using the Lund–Malmö formula.
cData presented for 20/21 patients.
Table 7.
Dendrin protein concentration (nucleus/foot processes) in IgAN/IgAV stratified by Banff classification system
| Score | |||||
|---|---|---|---|---|---|
| Variable | 0 | 1 | 2 | 3 | P-value |
| Inflammationa |
n = 11; 0.52 (0.24–0.71) |
n = 8; 0.38 (0.15–0.54) |
n = 1; 0.44 |
n = 0 | .08b |
| Intima fibrosisc |
n = 11; 0.39 (0.15–0.71) |
n = 3; 0.54 (0.26–0.58) |
n = 2; 0.40 (0.26–0.54) |
n = 3; 0.40 (0.39–0.44) |
.49e |
| Hyalinosisa |
n = 16; 0.42 (0.15–0.71) |
n = 2; 0.44 (0.18–0.54) |
n = 0 |
n = 1; 0.26 |
.44d |
Relative dendrin protein concentration (nucleus/foot processes) is presented as median (range). Comparison between groups performed using the Mann–Whitney U test. aData presented for 20/21 IgAN/IgAV patients.
bDue to the small sample size, comparison was made between groups scoring 0 and groups scoring 1–2.
cData presented for 19/21 IgAN/IgAV patients.
dDue to the small sample size, comparison was made between groups scoring 0 and groups scoring 1–3.
Table 9.
Dendrin protein expression (nucleus/cytoplasm) in IgAN/IgAV patients stratified by Banff classification system
| Score | P-value | ||||
|---|---|---|---|---|---|
| Variable | 0 | 1 | 2 | 3 | P-value |
| Inflammationa |
n = 11; 0.52 (0.24–0.71) |
n = 8; 0.38 (0.15–0.54) |
n = 1; 0.44 |
n = 0 | .07b |
| Intima fibrosisc |
n = 11; 0.42 (0.16–0.88) |
n = 3; 0.53 (0.28–0.68) |
n = 2; 0.46 (0.29–0.64) |
n = 3; 0.48 (0.47–0.48) |
.60d |
| Hyalinosisa |
n = 16; 0.49 (0.16–0.88) |
n = 2; 0.48 (0.22–0.53) |
n = 0; NA |
n = 1; 0.28 |
.29d |
Relative dendrin concentration (nucleus/cytoplasm) is presented as median (range). Comparisons are made with the Mann–Whitney U test. aData shown for 20/21 IgA patients.
bDue to the small sample size, comparison was made between groups scoring 0 and groups scoring 1–2.
cData shown for 19/21 IgA patients.
dDue to the small sample size, comparison was made between groups scoring 0 and groups scoring 1–3.
Table 10.
Dendrin protein expression (total podocyte concentration) in IgAN patients stratified by Oxford classification score
| Score | ||||
|---|---|---|---|---|
| Variable | 0 | 1 | 2 | P-value |
| M |
n = 8; 0.74 (0.38–1.52) |
n = 7; 0.96 (0.67–1.40) |
.28 | |
| E |
n = 13; 0.85 (0.38–1.52) |
n = 2; 0.63 (0.58–0.67) |
.09 | |
| S |
n = 5; 0.76 (0.38–1.52) |
n = 10; 0.80 (0.58–1.40) |
.81 | |
| T |
n = 7; 0.70 (0.38–1.52) |
n = 7; 0.93 (0.58–1.40) |
n = 1; 1.36 | .23a |
| C |
n = 9; 0.75 (0.38–1.52) |
n = 6; 1.03 (0.58–1.40) |
n = 0 | .48 |
Total protein dendrin concentration is presented as median (range). Comparisons are made with the Mann–Whitney U test or Kruskal–Wallis test.
aComparison made between T0 and T1–T2 due to the small sample size.
DISCUSSION
In this study we demonstrate a significant 2-fold increase in glomerular dendrin gene expression in IgAN/IgAV patients compared with controls. Stratifying patients according to disease severity, we revealed that this upregulation was most prominent in patients who still had preserved kidney function at the time of biopsy, but was less evident in patients with severe CKD (CKD stage 4). On the protein level, the spatial distribution and fluorescence intensity were similar between healthy and diseased kidneys in the areas where the glomerular capillary structure was preserved, whereas damaged glomerular structure in patients displayed weaker dendrin staining. Using ultrastructural analysis, we further revealed three histopathological subgroups of IgAN patients with higher relative nuclear concentrations of dendrin in podocytes: patients without mesangial hypercellularity, without segmental sclerosis and without significant tubular atrophy/interstitial fibrosis (M0, S0 and T0), all associated with milder forms of IgAN [26]. This is in line with our prospective follow-up analysis showing that higher relative nuclear dendrin protein concentration was associated with better preserved kidney function over time in IgAN/IgAV patients.
Despite IgAN being the most common glomerulonephritis worldwide [3], little is known about the molecular causes of albuminuria and prognostic factors. Dendrin, a podocyte-specific protein associated with podocytopenia and found in podocyte nuclei from IgAN patients, is therefore an interesting marker, potentially representing a mechanistic link between glomerulosclerosis and progressive kidney disease.
Previous experimental studies have shown that dendrin, under normal conditions, is located at the podocyte SD where it colocalizes with nephrin and CD2AP [9]. The importance of nephrin and CD2AP to maintain the SD, and hence a well-functioning glomerular filtration barrier, is well documented. Lack of nephrin, as well as CD2AP, leads to heavy proteinuria and eventually to podocyte loss and glomerulosclerosis [27]. Urokinase-type plasminogen activator receptor (uPAR), another protein within the SD anchoring complex, has been shown to be associated with the development of segmental sclerosis and CKD [28]. Overexpression of uPAR in mice leads to a glomerular morphology resembling focal segmental glomerulosclerosis [29] and increased urinary concentrations of uPAR have been found in IgAN patients scoring S1 according to the Oxford classification system [30]. Since dendrin is a part of the chain linking nephrin to the actin cytoskeleton, it is likely that dendrin is necessary to maintain the structure of the SD and associated with similar pathophysiology. Yet, dendrin knockout mice have normal life spans with no signs of proteinuria or morphological anomalies [31]. However, upon glomerular injury, TGF-β, under regulation of CD2AP, induces nuclear translocation of dendrin, where it potentially contributes to apoptosis [9, 10] as well as cytoskeleton rearrangement, resulting in proteinuria [10] and impaired kidney function [18]. Apoptosis leads to podocyte loss and subsequent podocytopenia and glomerulosclerosis [32]. Although different mouse models evidently show that dendrin is upregulated in kidney injury and correlates to proteinuria, glomerulosclerosis and progress to KF [9–11, 18, 33–35], studies of dendrin in human IgAN have failed to confirm these results.
In our human material, dendrin messenger RNA (mRNA) levels were markedly higher in IgAN kidneys compared with controls. Within-group analyses demonstrated a significant difference in dendrin gene expression between different CKD stages and that, despite an overlap between patients, the mRNA levels were predominantly and significantly higher in IgAN patients with milder CKD stages. On the protein level, we were unable to validate a significant difference in total concentration between patients and controls, suggesting that dendrin mRNA levels are not directly reflected in protein concentrations, which may be explained by posttranscriptional and posttranslational events [36]. On the other hand, in line with the mRNA results, we did observe less intense IF staining in areas with damaged glomerular structures compared with controls. Our findings are also corroborated by Kodama et al. [16], reporting higher nuclear staining in milder forms of IgAN compared with biopsies with severe lesions, as well as the study by Mizdrak et al. [17] that observed fewer dendrin-positive glomeruli in IgAN patients with lower eGFR and more tubulointerstitial damage.
To further investigate the clinical relevance of dendrin in IgAN kidneys, we evaluated histopathological features and longitudinal clinical data in relation to the cellular distribution of dendrin. The IgAN biopsies were scored according to the Oxford classification system, which is a widely accepted scoring system for classifying disease severity and predicting prognosis [26]. M and S correlate to progression of disease, whereas T correlates to severity of the disease at the time of biopsy [6]. We found that biopsies scoring M0, S0 and T0, thus classified as milder lesions, had a higher relative nuclear concentration of dendrin. Further ultrastructural evaluation showed that a higher relative nuclear concentration in patient biopsies was significantly associated with a slower annual decline in eGFR (∆GFR) and thus a better prognosis. These results lend support to further explore dendrin as a clinically relevant biomarker candidate that could be used as a complement to histopathological classification of IgAN patients, as well as a potential target for pharmaceutical intervention. In contrast to available data from mice studies describing dendrin as a key mediator for both apoptosis and proteinuria [9, 33, 37], our study, together with the results from previous studies on human IgAN [16, 17], indicate that dendrin may be a marker of a more favorable outcome. Further studies in larger cohorts as well as mechanistic studies are needed to support and delineate the biological causes underlying these observational data.
This study has some limitations. Although we performed analyses in, to our knowledge, the largest and most comprehensively described human IgAN cohort in the context of dendrin, the sample size was still relatively small and may thus have affected the sensitivity of the study. Furthermore, patients and control groups were not matched for age and sex and even if no statistical association was detected between dendrin expression and age or sex, we cannot rule out the possibility that it may have influenced our results. Moreover, due to the scarcity of patient material, we had no possibility to validate our microarray data with quantitative polymerase chain reaction. Nevertheless, as other well-known podocyte markers (nephrin, podocin and synaptopodin) derived from the same microarray dataset behaved as expected without upregulation in diseased kidneys (Supplementary data, Figure 2), we believe our dendrin findings are reliable. It should also be mentioned that the microarray control material came from deceased kidney donors, often associated with ischemic injury. Thus it is possible that ischemic changes present in the control tissue may have affected the results by masking the true difference in gene expression between patients and controls. In the iEM analyses, the control material was obtained from living kidney donors, which is known to be of much better quality with only minor ischemic changes.
To conclude, in the present study we describe the expression profile of dendrin both at the RNA and protein level in human IgAN/IgAV kidneys in relation to clinical and histopathological parameters. The combined data suggest that dendrin is increased in patients with milder histopathological lesions and better kidney function over time. More supportive data from larger patient cohorts are needed to further define the role of dendrin and whether dendrin can be used for clinical purposes predicting outcomes in individual patients.
Supplementary Material
ACKNOWLEDGEMENTS
The authors would like to thank Anneli Ring, Karolinska University Hospital, for technical assistance, Miyuki Katayama, Uppsala University, for carrying out parts of the microarray experiments and Abdul Rashid Qureshi, Karolinska Institutet, for statistical guidance.
Contributor Information
Anna Levin, Department of Clinical Science, Intervention and Technology, Divison of Renal Medicine, Karolinska Institutet, Stockholm, Sweden.
Angelina Schwarz, Department of Clinical Science, Intervention and Technology, Divison of Renal Medicine, Karolinska Institutet, Stockholm, Sweden.
Jenny Hulkko, Department of Clinical Science, Intervention and Technology, Divison of Renal Medicine, Karolinska Institutet, Stockholm, Sweden.
Liqun He, Department of Immunology, Genetics and Pathology, Uppsala University, Uppsala, Sweden.
Ying Sun, Department of Immunology, Genetics and Pathology, Uppsala University, Uppsala, Sweden.
Peter Barany, Department of Clinical Science, Intervention and Technology, Divison of Renal Medicine, Karolinska Institutet, Stockholm, Sweden.
Annette Bruchfeld, Department of Clinical Science, Intervention and Technology, Divison of Renal Medicine, Karolinska Institutet, Stockholm, Sweden; Department of Health, Medicine and Caring Sciences, Linköpings Universitet Hälsouniversitetet, Linkoping, Sweden.
Maria Herthelius, Department of Clinical Science, Intervention, and Technology, Division of Pediatrics, Karolinska Institutet, Stockholm, Sweden.
Lars Wennberg, Department of Clinical Science, Intervention and Technology, Division of Transplantation Surgery, Karolinska University Hospital, Karolinska Institutet, Stockholm, Sweden.
Kerstin Ebefors, Department of Physiology, Institute of Neuroscience and Physiology, Sahlgrenska Academy, University of Gothenburg, Gothenburg, Sweden.
Jaakko Patrakka, Department of Laboratory Medicine, Karolinska Institutet, Stockholm, Sweden.
Christer Betsholtz, Department of Immunology, Genetics and Pathology, Uppsala University, Uppsala, Sweden.
Jenny Nyström, Department of Physiology, Institute of Neuroscience and Physiology, Sahlgrenska Academy, University of Gothenburg, Gothenburg, Sweden.
Johan Mölne, Department of Laboratory Medicine, Institute of Biomedicine, Sahlgrenska Academy, University of Gothenburg, Gothenburg, Sweden.
Kjell Hultenby, Department of Laboratory Medicine, Karolinska Institutet, Stockholm, Sweden.
Anna Witasp, Department of Clinical Science, Intervention and Technology, Divison of Renal Medicine, Karolinska Institutet, Stockholm, Sweden.
Annika Wernerson, Department of Clinical Science, Intervention and Technology, Divison of Renal Medicine, Karolinska Institutet, Stockholm, Sweden.
FUNDING
This research was supported by grants provided by the Stockholm County Council (ALF Project), the Swedish Kidney Foundation and the Stig and Gunborg Westman Foundation.
AUTHORS’ CONTRIBUTIONS
A.L., A.Wi., J.H., K.H., J.Ny. and A.We. designed the study. A.L., A.S., Y.S., P.B., A.B., L.W., M.H., K.E., J.M., K.H. and A.We. acquired the data. A.L., A.Wi., L.H., K.E., J.P., C.B., J.Ny., J.M., K.H. and A.We. analyzed the data and interpreted the results. A.L., A.Wi. and AWe. drafted the article. All authors revised the article and approved the final version.
DATA AVAILABILITY STATEMENT
The data supporting the findings of this study are not currently available in a public repository but can be made available upon request to the corresponding author.
CONFLICT OF INTEREST STATEMENT
P.B. has a speaking contract with Fresenius, outside the submitted work. A.B. has received consulting fees from AstraZeneca, Bayer, Chemocentryx, Fresenius, Merck/MSD and Vifor, outside the submitted work. J.P.'s research is supported by AstraZeneca and Guard Therapeutics, outside the submitted work. J.N. has received consultant fees from AstraZeneca, outside the submitted work.
REFERENCES
- 1. Kidney Disease: Improving Global Outcomes Glomerular Diseases Work Group . KDIGO 2021 clinical practice guideline for the management of glomerular diseases. Kidney Int 2021;100:S1–276. [DOI] [PubMed] [Google Scholar]
- 2. Jennette JC, Falk RJ, Andrassy Ket al. Nomenclature of systemic vasculitides. Proposal of an international consensus conference. Arthritis Rheum 1994;37:187–92. [DOI] [PubMed] [Google Scholar]
- 3. Rychlik I, Andrassy K, Waldherr Ret al. Clinical features and natural history of IgA nephropathy. Ann Med Interne (Paris) 1999;150:117–26. [PubMed] [Google Scholar]
- 4. Roberts IS, Cook HT, Troyanov Set al. The Oxford classification of IgA nephropathy: pathology definitions, correlations, and reproducibility. Kidney Int 2009;76:546–56. [DOI] [PubMed] [Google Scholar]
- 5. Cattran DC, Coppo R, Cook HTet al. The Oxford classification of IgA nephropathy: rationale, clinicopathological correlations, and classification. Kidney Int 2009;76:534–45. [DOI] [PubMed] [Google Scholar]
- 6. Barbour SJ, Espino-Hernandez G, Reich HNet al. The MEST score provides earlier risk prediction in IgA nephropathy. Kidney Int 2015;89:167–75. [DOI] [PubMed] [Google Scholar]
- 7. Trimarchi H, Barratt J, Cattran DCet al. Oxford classification of IgA nephropathy 2016: an update from the IgA Nephropathy Classification Working Group. Kidney Int 2017;91:1014–21. [DOI] [PubMed] [Google Scholar]
- 8. Jones N, Blasutig IM, Eremina Vet al. Nck adaptor proteins link nephrin to the actin cytoskeleton of kidney podocytes. Nature 2006;440:818–23. [DOI] [PubMed] [Google Scholar]
- 9. Asanuma K, Campbell KN, Kim Ket al. Nuclear relocation of the nephrin and CD2AP-binding protein dendrin promotes apoptosis of podocytes. Proc Natl Acad Sci USA 2007;104:10134–9. [DOI] [PMC free article] [PubMed] [Google Scholar]
- 10. Yaddanapudi S, Altintas MM, Kistler ADet al. CD2AP in mouse and human podocytes controls a proteolytic program that regulates cytoskeletal structure and cellular survival. J Clin Invest 2011;121:3965–80. [DOI] [PMC free article] [PubMed] [Google Scholar]
- 11. Asanuma K, Akiba-Takagi M, Kodama Fet al. Dendrin location in podocytes is associated with disease progression in animal and human glomerulopathy. Am J Nephrol 2011;33:537–49. [DOI] [PubMed] [Google Scholar]
- 12. Kriz W, Elger M, Nagata Met al. The role of podocytes in the development of glomerular sclerosis. Kidney Int Suppl 1994;45:S64–72. [PubMed] [Google Scholar]
- 13. Kriz W, Hosser H, Hähnel Bet al. From segmental glomerulosclerosis to total nephron degeneration and interstitial fibrosis: a histopathological study in rat models and human glomerulopathies. Nephrol Dial Transplant 1998;13:2781–98. [DOI] [PubMed] [Google Scholar]
- 14. Shankland SJ. The podocyte's response to injury: role in proteinuria and glomerulosclerosis. Kidney Int 2006;69:2131–47. [DOI] [PubMed] [Google Scholar]
- 15. Lemley KV, Lafayette RA, Safai Met al. Podocytopenia and disease severity in IgA nephropathy. Kidney Int 2002;61:1475–85. [DOI] [PubMed] [Google Scholar]
- 16. Kodama F, Asanuma K, Takagi Met al. Translocation of dendrin to the podocyte nucleus in acute glomerular injury in patients with IgA nephropathy. Nephrol Dial Transplant 2013;28:1762–72. [DOI] [PubMed] [Google Scholar]
- 17. Mizdrak M, Vukojevic K, Filipovic Net al. Expression of DENDRIN in several glomerular diseases and correlation to pathological parameters and renal failure–preliminary study. Diagn Pathol 2018;13:90. [DOI] [PMC free article] [PubMed] [Google Scholar]
- 18. Weins A, Wong JS, Basgen JMet al. Dendrin ablation prolongs life span by delaying kidney failure. Am J Pathol 2015;185:2143–57. [DOI] [PMC free article] [PubMed] [Google Scholar]
- 19. Duner F, Patrakka J, Xiao Zet al. Dendrin expression in glomerulogenesis and in human minimal change nephrotic syndrome. Nephrol Dial Transplant 2008;23:2504–11. [DOI] [PubMed] [Google Scholar]
- 20. Roufosse C, Simmonds N, Clahsen-van Groningen Met al. A 2018 reference guide to the Banff classification of renal allograft pathology. Transplantation 2018;102:1795–814. [DOI] [PMC free article] [PubMed] [Google Scholar]
- 21. Levey AS, Stevens LA, Schmid CHet al. A new equation to estimate glomerular filtration rate. Ann Intern Med 2009;150:604–12. [DOI] [PMC free article] [PubMed] [Google Scholar]
- 22. Bjork J, Back SE, Sterner Get al. Prediction of relative glomerular filtration rate in adults: new improved equations based on Swedish Caucasians and standardized plasma-creatinine assays. Scand J Clin Lab Invest 2007;67:678–95. [DOI] [PubMed] [Google Scholar]
- 23. Nyman U, Bjork J, Lindstrom Vet al. The Lund-Malmo creatinine-based glomerular filtration rate prediction equation for adults also performs well in children. Scand J Clin Lab Invest 2008;68:568–76. [DOI] [PubMed] [Google Scholar]
- 24. Patrakka J, Xiao Z, Nukui Met al. Expression and subcellular distribution of novel glomerulus-associated proteins dendrin, ehd3, sh2d4a, plekhh2, and 2310066E14Rik. J Am Soc Nephrol 2007;18:689–97. [DOI] [PubMed] [Google Scholar]
- 25. Weibel ER. Stereological Methods: Practical Methods for Biological Morphometry. London: Academic, 1979. [Google Scholar]
- 26. Barbour SJ, Espino-Hernandez G, Reich HNet al. The MEST score provides earlier risk prediction in lgA nephropathy. Kidney Int 2016;89:167–75. [DOI] [PubMed] [Google Scholar]
- 27. Patrakka J, Tryggvason K.. Molecular make-up of the glomerular filtration barrier. Biochem Biophys Res Commun 2010;396:164–9. [DOI] [PubMed] [Google Scholar]
- 28. Peev V, Hahm E, Reiser J.. Unwinding focal segmental glomerulosclerosis. F1000Research 2017;6:466. [DOI] [PMC free article] [PubMed] [Google Scholar]
- 29. Wei C, Li J, Adair BDet al. uPAR isoform 2 forms a dimer and induces severe kidney disease in mice. J Clin Invest 2019;129:1946–59. [DOI] [PMC free article] [PubMed] [Google Scholar]
- 30. Trimarchi H, Canzonieri R, Schiel Aet al. In IgA nephropathy, glomerulosclerosis is associated with increased urinary CD80 excretion and urokinase-type plasminogen activator receptor-positive podocyturia. Nephron Extra 2017;7:52–61. [DOI] [PMC free article] [PubMed] [Google Scholar]
- 31. Xiao Z, Rodriguez PQ, He Let al. Wtip- and gadd45a-interacting protein dendrin is not crucial for the development or maintenance of the glomerular filtration barrier. PLoS One 2013;8:e83133. [DOI] [PMC free article] [PubMed] [Google Scholar]
- 32. Mundel P, Shankland SJ.. Podocyte biology and response to injury. J Am Soc Nephrol 2002;13:3005–15. [DOI] [PubMed] [Google Scholar]
- 33. Campbell KN, Wong JS, Gupta Ret al. Yes-associated protein (YAP) promotes cell survival by inhibiting proapoptotic dendrin signaling. J Biol Chem 2013;288:17057–62. [DOI] [PMC free article] [PubMed] [Google Scholar]
- 34. Meliambro K, Wong JS, Ray Jet al. The hippo pathway regulator KIBRA promotes podocyte injury by inhibiting YAP signaling and disrupting actin cytoskeletal dynamics. J Biol Chem 2017;292:21137–48. [DOI] [PMC free article] [PubMed] [Google Scholar]
- 35. Shirata N, Ihara KI, Yamamoto-Nonaka Ket al. Glomerulosclerosis induced by deficiency of membrane-associated guanylate kinase inverted 2 in kidney podocytes. J Am Soc Nephrol 2017;28:2654–69. [DOI] [PMC free article] [PubMed] [Google Scholar]
- 36. Maier T, Güell M, Serrano L.. Correlation of mRNA and protein in complex biological samples. FEBS Lett 2009;583:3966–73. [DOI] [PubMed] [Google Scholar]
- 37. Lin T, Zhang L, Liu Set al. WWC1 promotes podocyte survival via stabilizing slit diaphragm protein dendrin. Mol Med Rep 2017;16:8685–90. [DOI] [PMC free article] [PubMed] [Google Scholar]
Associated Data
This section collects any data citations, data availability statements, or supplementary materials included in this article.
Supplementary Materials
Data Availability Statement
The data supporting the findings of this study are not currently available in a public repository but can be made available upon request to the corresponding author.