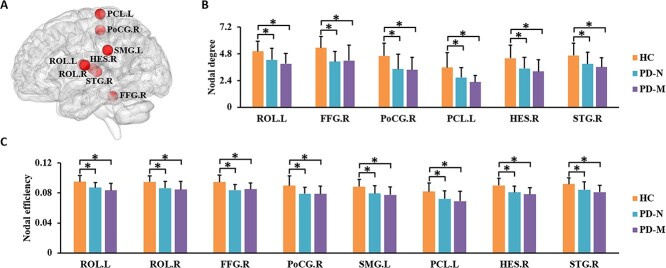
Figure 2.
Brain regions showing abnormal nodal centrality in functional brain networks in the three groups. In (A), regions with significant group differences (P < 0.05, FDR corrected) are visualized using the BrainNet viewer (http://www.nitrc.org/projects/bnv). The bar graphs show the post hoc pairwise comparisons with significant differences in (B) nodal degree and (C) nodal efficiency. The y-axes are the area under the curve of the two network parameters and the three groups are color coded as in the key. The x-axis shows the brain regions. Abbreviations: PD, Parkinson’s disease; PD-M, PD with mild cognitive impairment; PD-N, PD with normal cognition; HC, healthy control; ROL, Rolandic operculum; FFG, fusiform gyrus; PoCG, postcentral gyrus; SMG, supramarginal gyrus; PCL, paracentral lobule; HES, Heschl gyrus; STG, superior temporal gyrus; L, left; R, right.

