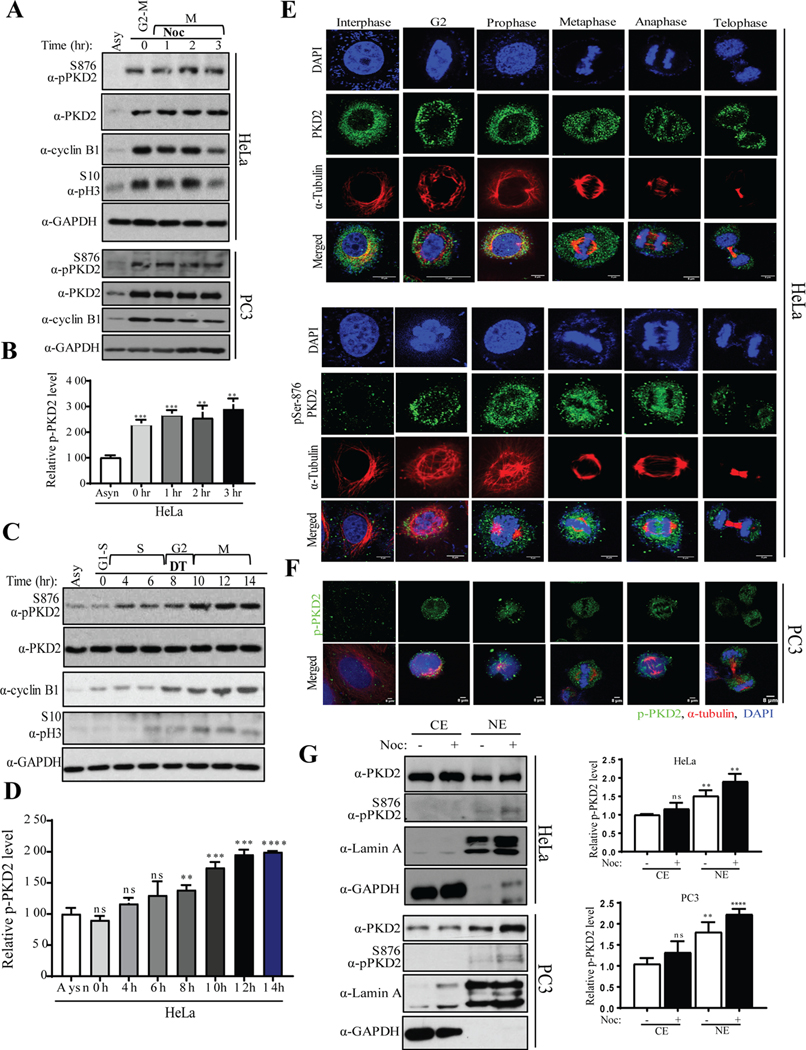
Figure. 1.
PKD is activated during mitotic entry. A) HeLa and PC3 cells were synchronized with nocodazole (100 ng/ml) for 16 hr and mitotic cells were released into fresh medium for indicated times. Cell extracts from each sample were subjected to Western blot analysis to analyze activation of PKD2. B) Densitometric quantification of phospho-PKD2S876 from the immunoblot of HeLa was performed. C) Western blot analysis of indicated proteins after the HeLa cells were released from a double thymidine (DT) block was performed. D) Densitometric quantification of phospho-PKD2S876 from the immunoblot of C was performed. Different phases of cell cycle are marked (G1, S, G2 and M). E) HeLa cells were subjected to immunofluorescence (IF) staining to visualize co-localization PKD2 or phospho-PKD2S876 with α-tubulin during different phases of cell cycle. F) PC3 cells were subjected to IF staining to visualize co-localization of phospho-PKD2S876 with α-tubulin during different phases of cell cycle. DAPI was used to stain the nucleus. Scale bar indicates 8μm. GAPDH was used as loading control in A and C. G) HeLa and PC3 cells were synchronized with nocodazole (100 ng/ml) for 16 hr and mitotic cells were collected by shake-off. Cytoplasmic (Cyto) and nuclear (Nuc) fractions were prepared and the samples were analyzed by Western blotting with indicated antibodies (left panel). Relative amount of phospho-PKD2S876 was quantified (right panel). The graphs show average of three independent experiments with error bars representing standard estimated mean (SEM) (** p < 0.01, *** p < 0.001, **** p < 0.0001, ns: not significant).

