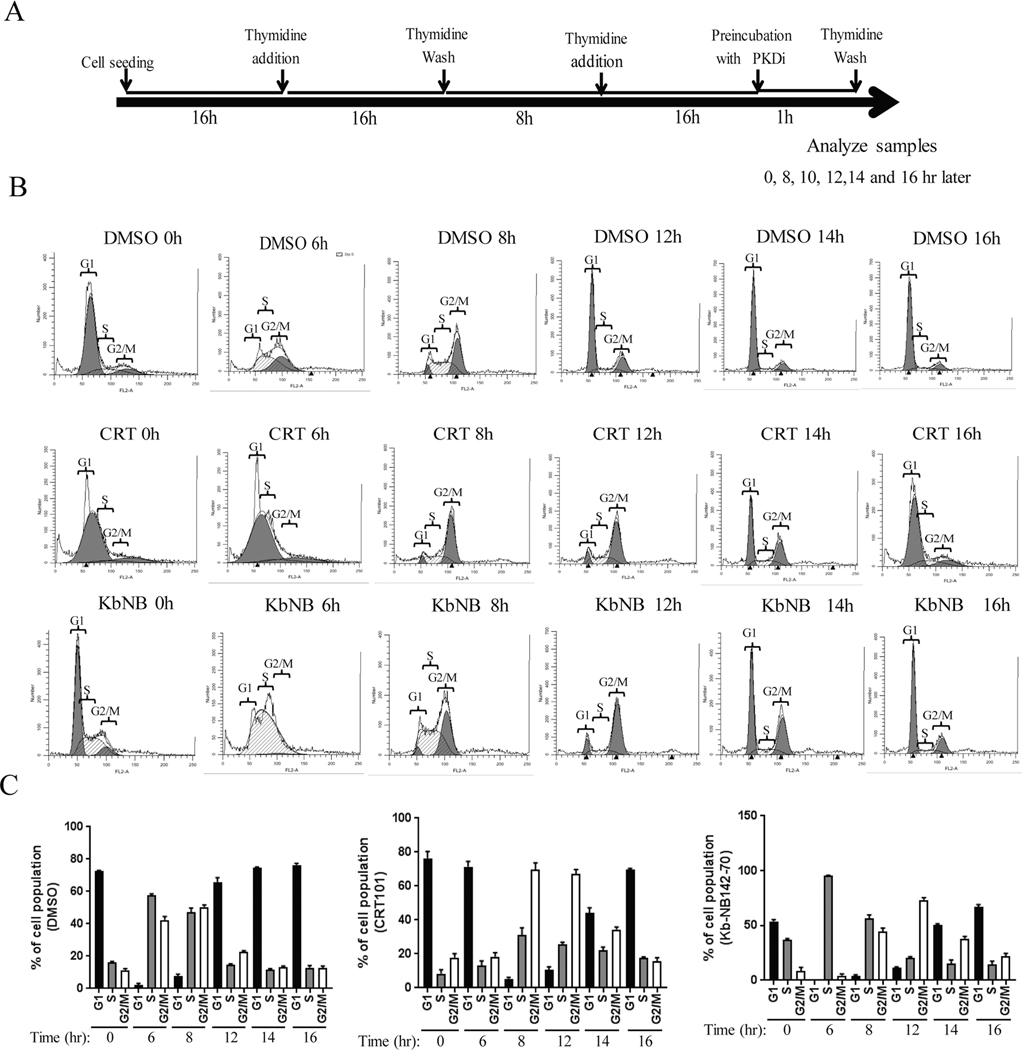
Figure. 2.
Inactivation of PKD by CRT101 and kb-NBinduces a delay in G2-M progression. A) Schematic representation of experimental design is shown. B) Flow cytometry analysis of cells treated with DMSO, CRT101 and kb-NB were performed according to A. C) Summarizing graph of the distribution of different phases of cell cycle are shown (right panels). The graphs show average of three independent experiments with error bars representing SEM.

