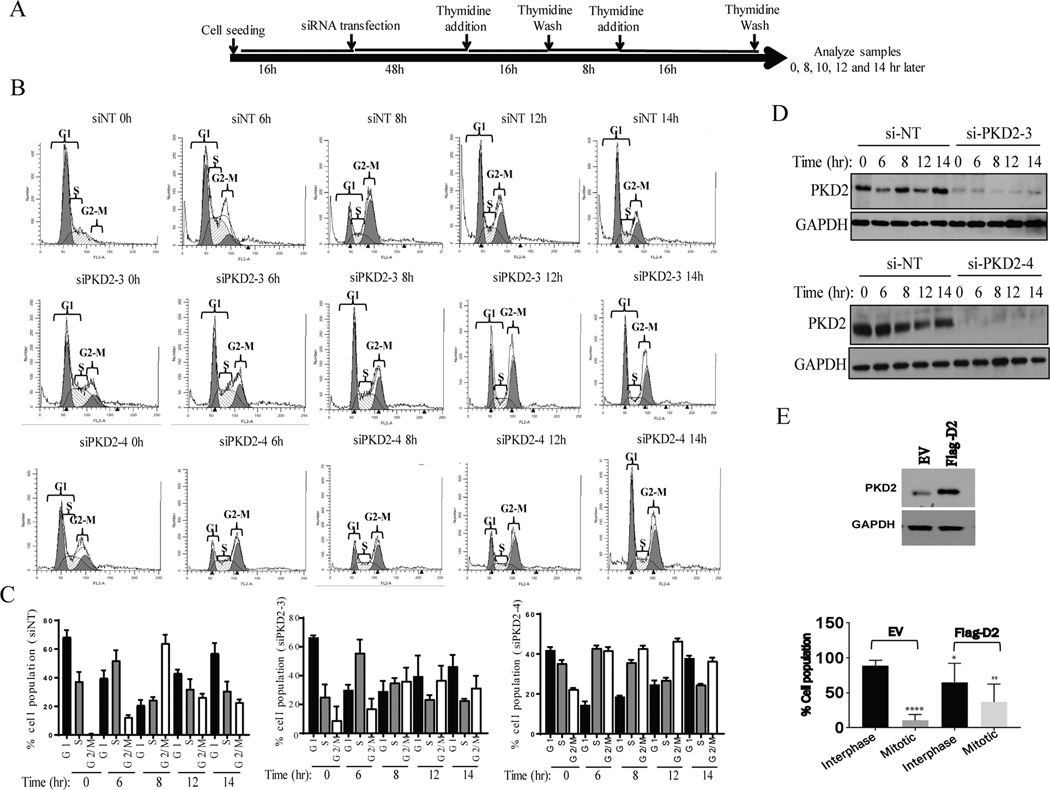
Figure. 3.
Abrogation of PKD2 expression delays G2-M progression. A) Schematic representation of experimental design is shown. B) Flow cytometry analysis of cells transfected with control non-targeting siRNA (siNT) and two siRNAs against PKD2 was performed according to A. C) Summarizing graph of the distribution of different phases of cell cycle are shown. The graphs show average of three independent experiments with error bars representing SEM. D) Western blot analysis of the samples from A was performed to confirm knockdown of PKD2. GAPDH was used as loading control. E) PKD2 was ectopically overexpressed using a plasmid expressing Flag-PKD2 (top panel) and percentage of interphase and mitotic cell population was counted (bottom panel). The graphs show average of three independent experiments with error bars representing SEM (* p<0.5, ** p < 0.01, **** p < 0.0001).

