Figure. 4.
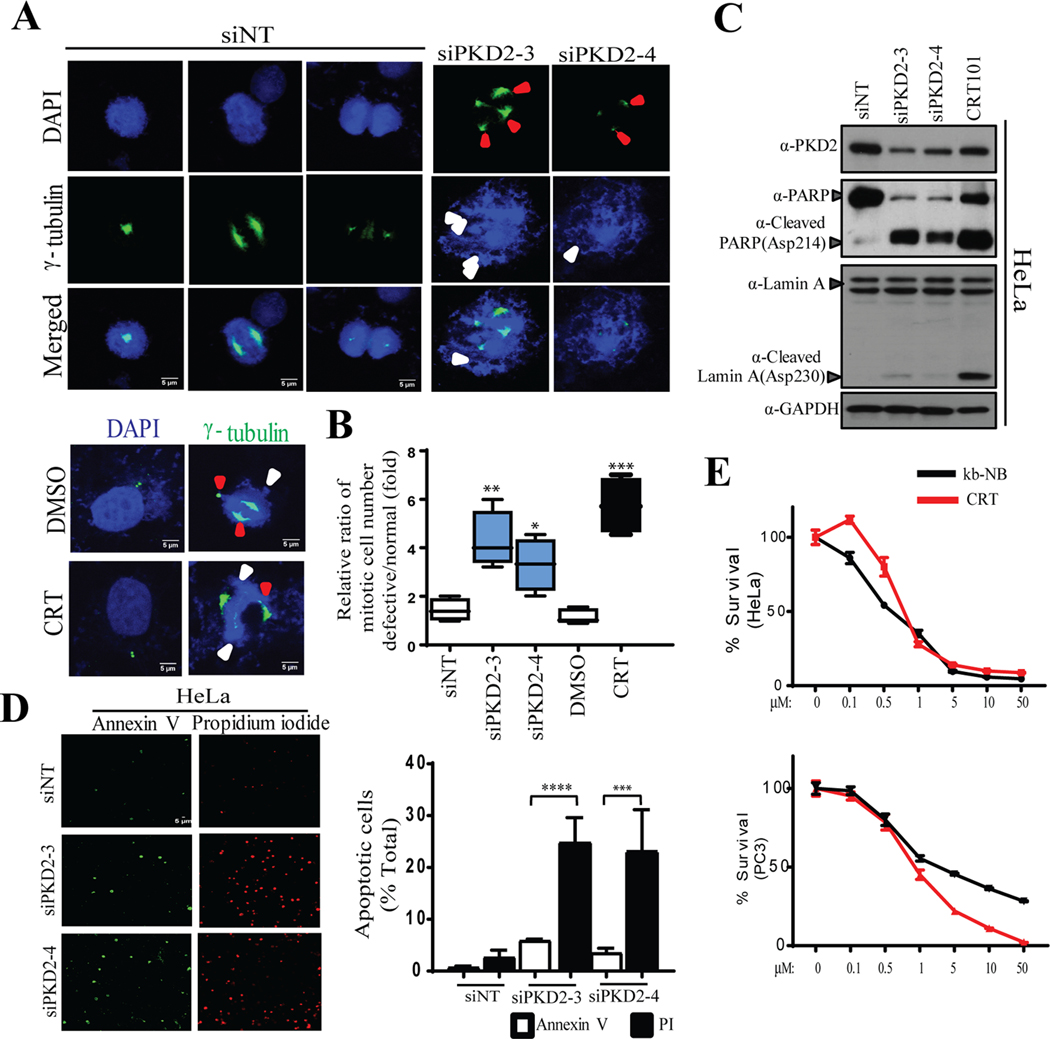
Knockdown of PKD2 causes mitotic catastrophe followed by cell death. A) IF staining of cells transfected with control non-targeting siRNA (siNT) and two siRNAs against PKD2 (upper panel) or DMSO/CRT101 (bottom panel) was performed to visualize γ-tubulin (green). DAPI was used to stain the nucleus. Red and white arrow heads indicate defects in spindle pole formation and misaligned chromosomes, respectively. B) Quantification of cell population harboring mitotic defects after the cells were treated with either si-PKD2 (top panel) or CRT101 (bottom panel) was performed. C) Western blot was done to show cleavage of PARP/Lamin A upon depletion or inactivation of PKD2 in HeLa. GAPDH served as loading control. D) Microscopic analysis of cells transfected with siNT or two siPKD2s after co-staining with Annexin V-Alexa Fluor 488 and propidium iodide (PI) was performed (left panel). Quantification of cell population positive for Annexin V-Alexa Fluor 488 and PI (right panel) was performed. E) Hela and PC3 cells were treated with different concentrations of PKD inhibitors (CRT101, kb-NB) and cultured for 72 hr. MTT assay was performed to assess cell viability. The graphs show average of three independent experiments with error bars representing SEM (*** p < 0.001, **** p < 0.0001).

