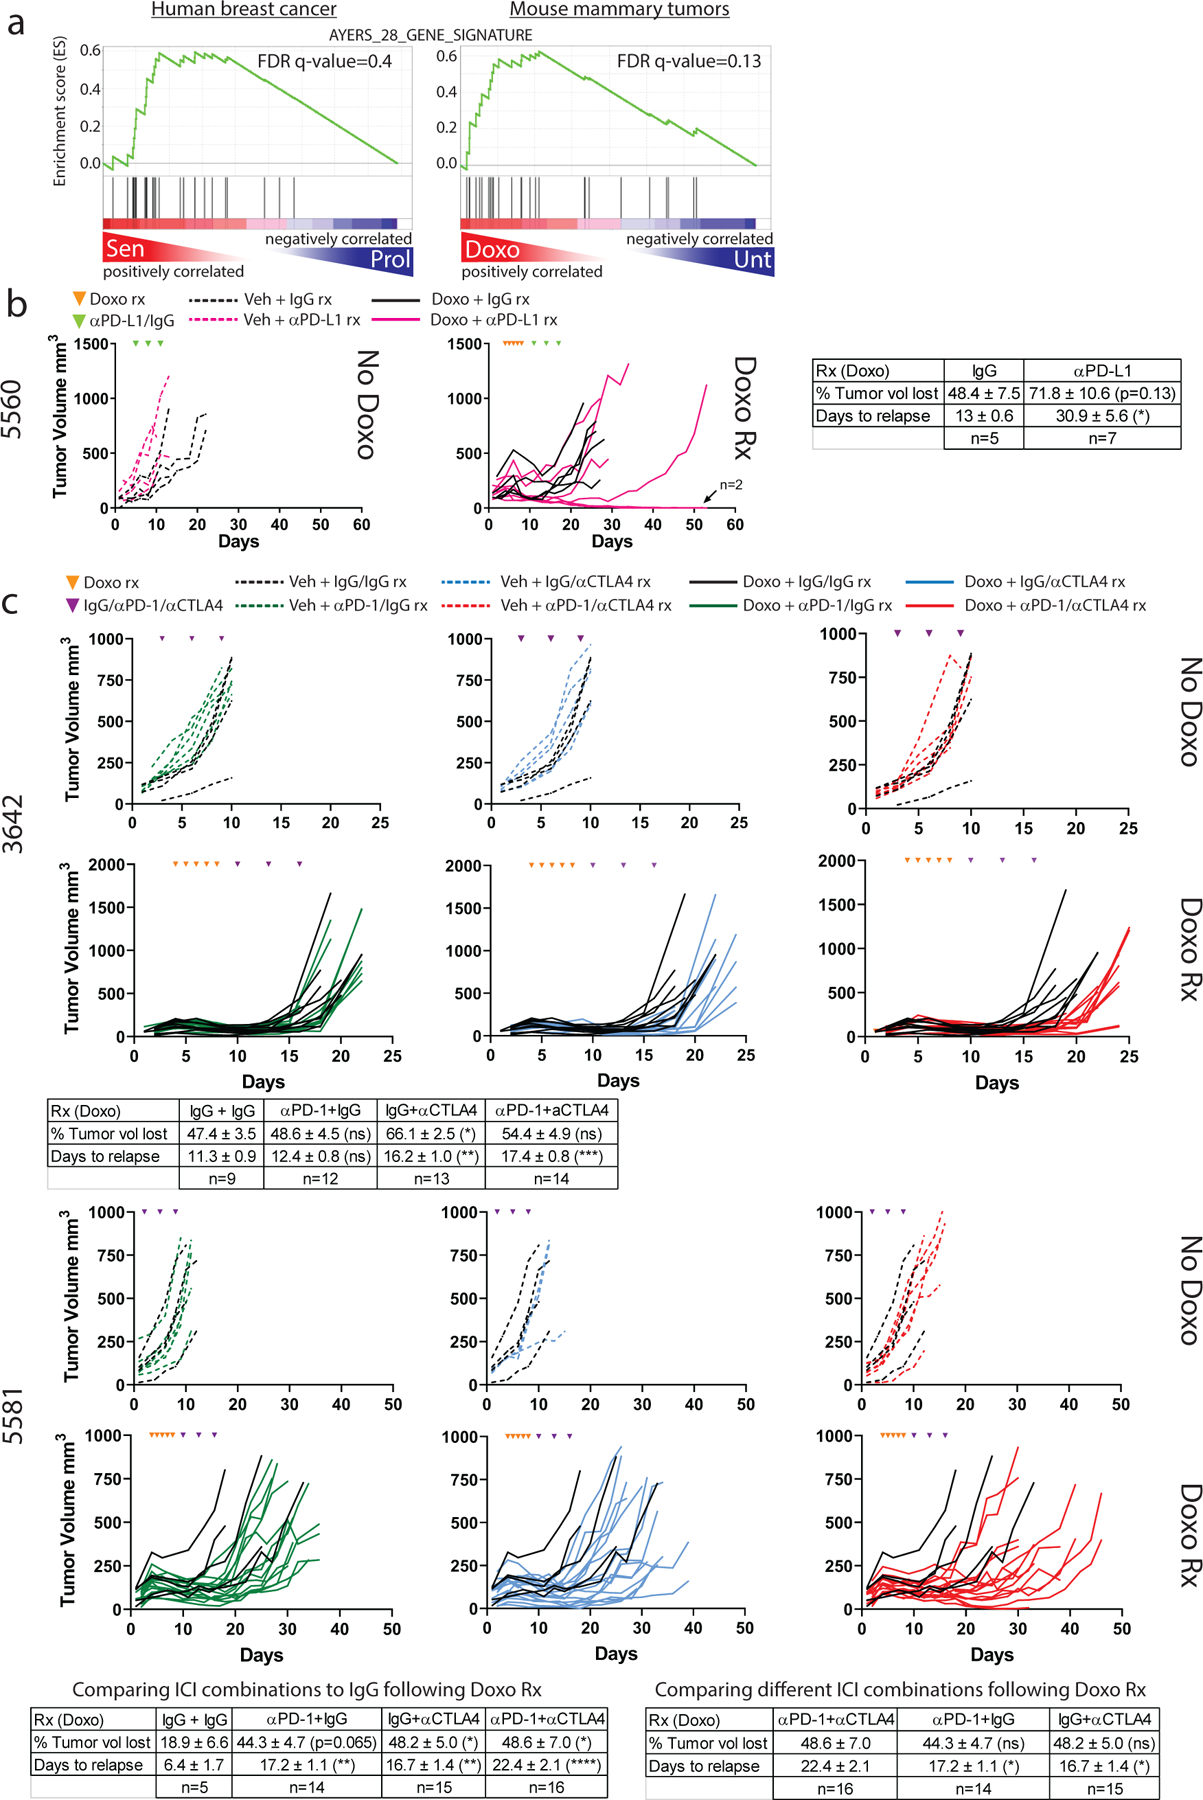
Figure 7. Complete mammary tumor eradication and durable response in one third of mice treated with chemotherapy followed by αPD-L1.

A). GSEA was performed on the same chemotherapy treated and untreated human and mouse tumors as in Fig. 1 using a 28 gene panel shown to predict response to ICI48. B) One MMTV-Wnt1 tumor (5560) was transplanted in parallel into C57BL/6j mice. When tumors became ~200mm3, mice were randomized to four groups: 1) IgG alone, n=4 tumors (black dashed lines, left graph); 2) αPD-L1 alone, n=4 tumors (pink dashed lines, left graph), 3) doxorubicin treatment followed by IgG, n=5 tumors (black lines, right graph); 4) doxorubicin treatment followed by αPD-L1, n=7 tumors (pink lines, right graph). Doxorubicin treatments are indicated in the graph by orange arrowheads, IgG/PD-L1 treatments are indicated by green triangles. C) MMTV-Wnt1 tumors 3642 (top) or 5581 (bottom) were transplanted in parallel into C57BL/6j mice. When tumors became ~200mm3, mice were randomized to 8 treatment groups: 1) IgG+IgG alone (3642 n=4, 5581 n=4 tumors) (black dashed lines); 2) αPD-1+IgG alone (3642 n=6, 5581 n=6 tumors) (green dashed lines); 3) IgG+αCTLA4 alone (3642 n=5, 5581 n=3 tumors) (blue dashed lines); 4) αPD-1+αCTLA4 alone (3642 n=6, 5581 n=6 tumors) (red dashed line); 5) doxorubicin treatment followed by IgG+IgG (3642 n=9, 5581 n=5 tumors) (black solid lines); 6) doxorubicin treatment followed by αPD-1+IgG (3642 n=12, 5581 n=14 tumors) (green lines); 7) doxorubicin treatment followed by IgG+αCTLA4 (3642 n=13, 5581 n=15 tumors) (blue solid lines); 8) doxorubicin treatment followed by αPD-1+αCTLA4 (3642 n=14, 5581 n=15 tumors). The 5 doxorubicin treatment days are indicated in the graphs by orange arrowheads, the 3 IgG/αPD-L1/αCTLA4 treatment days are indicated purple triangles. Tables showing mean percent tumor volume lost and days to relapse after indicated treatments are provided for each transplant experiment. SEM is provided for each value. Statistical significance was determined using two-tailed Student’s T-test for comparisons of two groups (B), and one-way ANOVA with Tukey’s posttest for comparisons of three or more groups (C-D).
