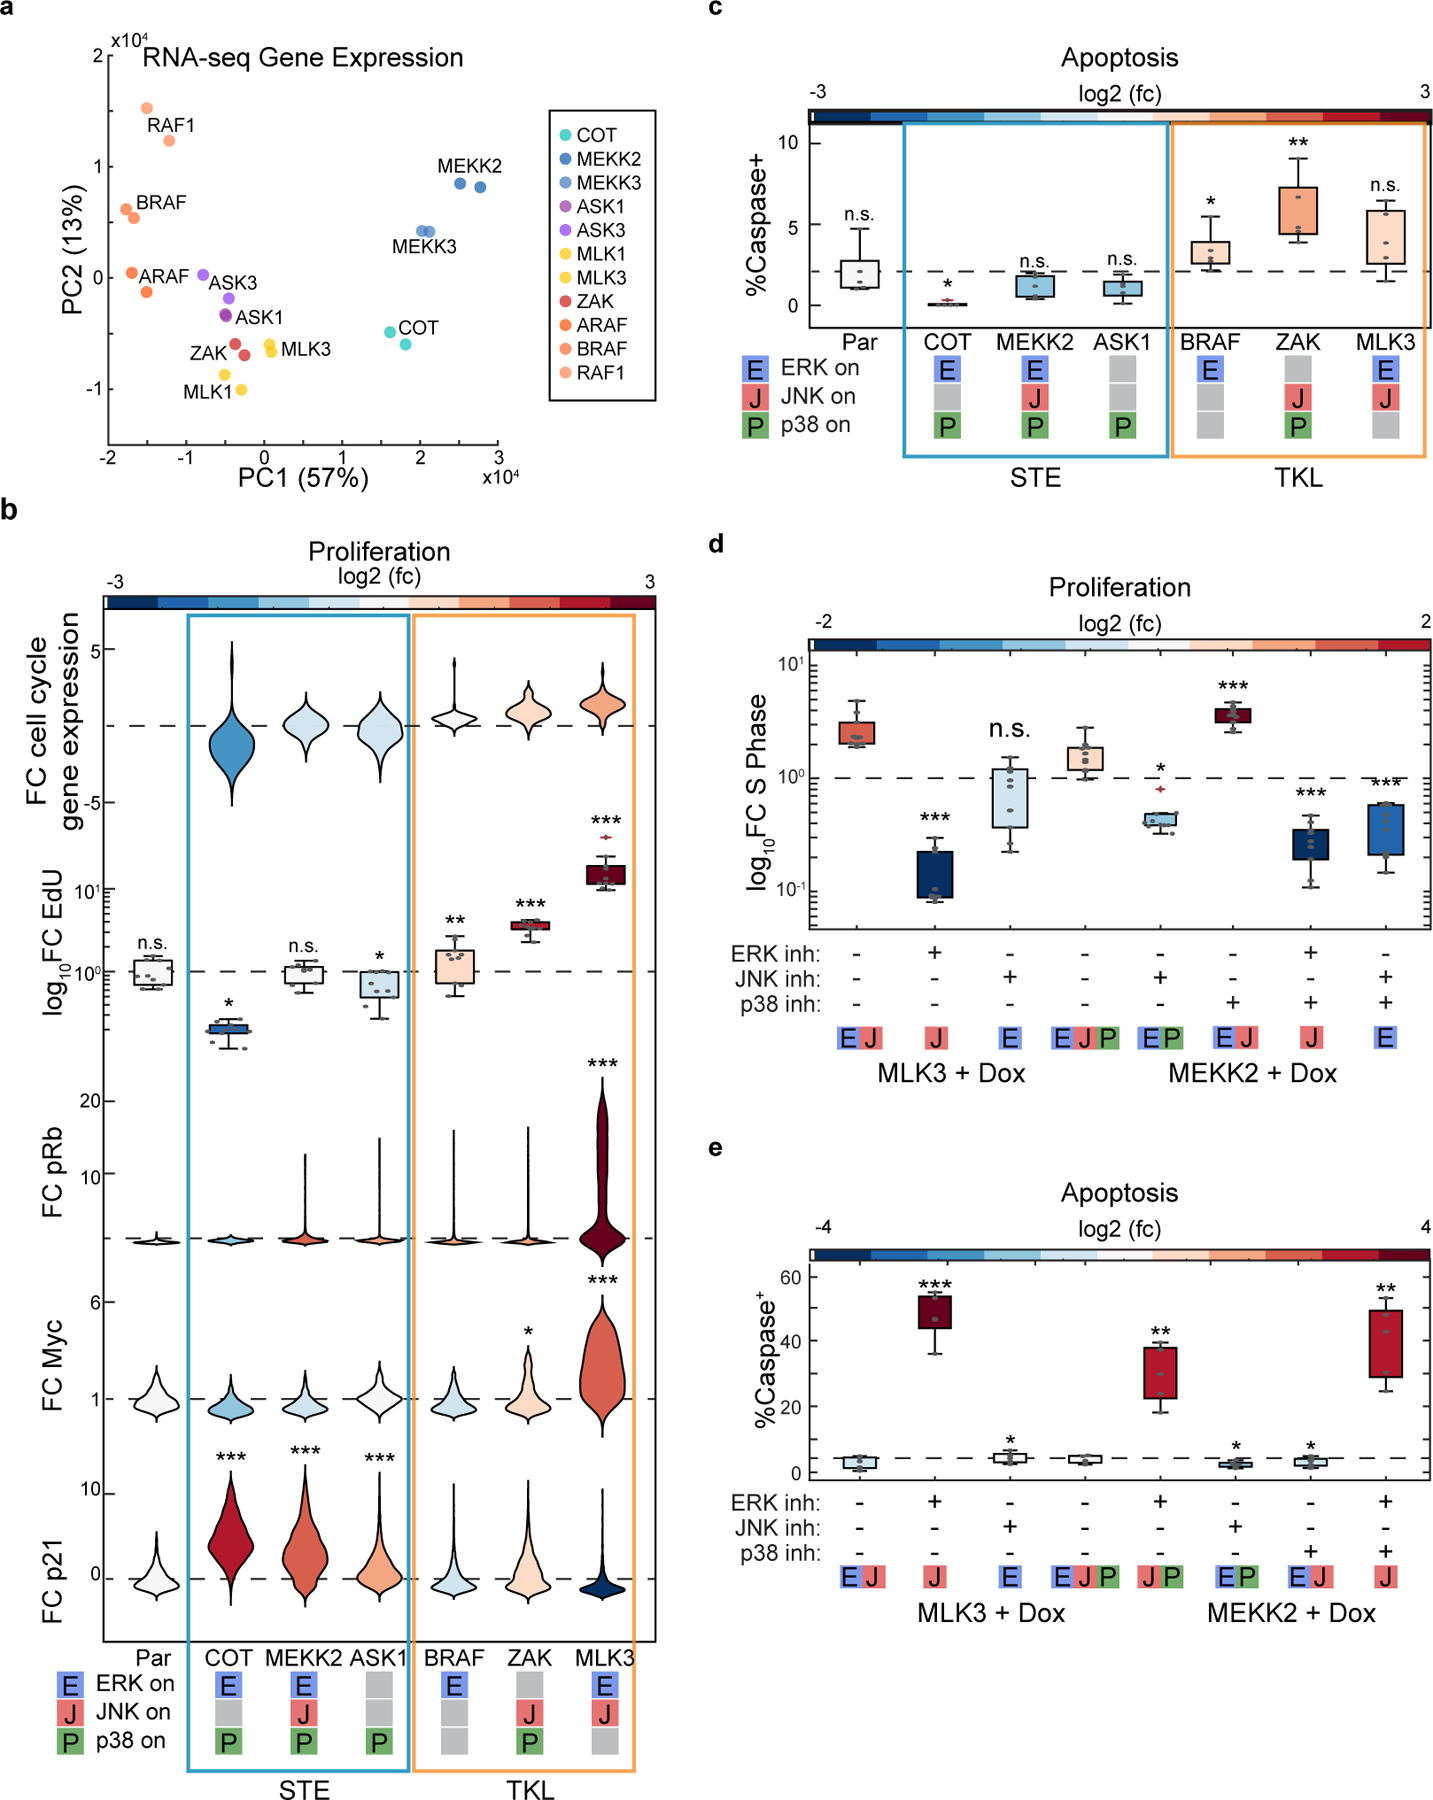
Figure 5. MAP3Ks coordinate cell fate through combinations of MAPK activity.

a. PCA Analysis of RNA-sequencing results of indicated MAP3K inductions. b. Cell fate analysis by RNA sequencing (fold-change cell cycle markers), EdU incorporation, and immunofluorescence (pRb, Myc, p21) as described in methods. Violin or box plots represent the relative changes in cell fate, colors represent the log2 fold change over the parental (see methods for details). (n>2000 cells for all imaging assays). c. Cell fate analysis by RNA sequencing, live imaging (dXY, Caspase dye) violin or box plots represent the relative changes in cell fate, colors represent the log2 fold change over the parental (see methods for details). (n>250 cells per live conditions). d. MCF10A cells containing TRE3G::MLK3 or TRE3G::MEKK2 were grown to confluence before overnight serum starvation and treatment with doxycycline (2 μg/ml) and indicated inhibitor or vehicle control. Box plots represent fold change of EdU+ cells in each condition over the no doxycycline control. Statistical significance was determined over the doxycycline + vehicle of a given cell line. e. Serum starved MCF10A cells containing TRE3G::MLK3 or TRE3G::MEKK2 were treated with vehicle control or indicated inhibitor combination and doxycycline (2 μg/ml) imaged every 5 min for 24 hours in media containing 10 μM CellEvent Caspase 3/7 Green Detection Reagent (see methods for details). Box plots indicating the percent of cells in each technical replicate that initiate apoptosis. Colors indicate the fold change over the no doxycycline control for that cell line. n>800 cells per condition). For all box plots, P-values were quantified using 2-way Anova. For all violin plots, P-values were quantified using 2-way Anova and a Bonferroni correction. *p<.05, **p<.01, ***p<.001
