Fig. 2.

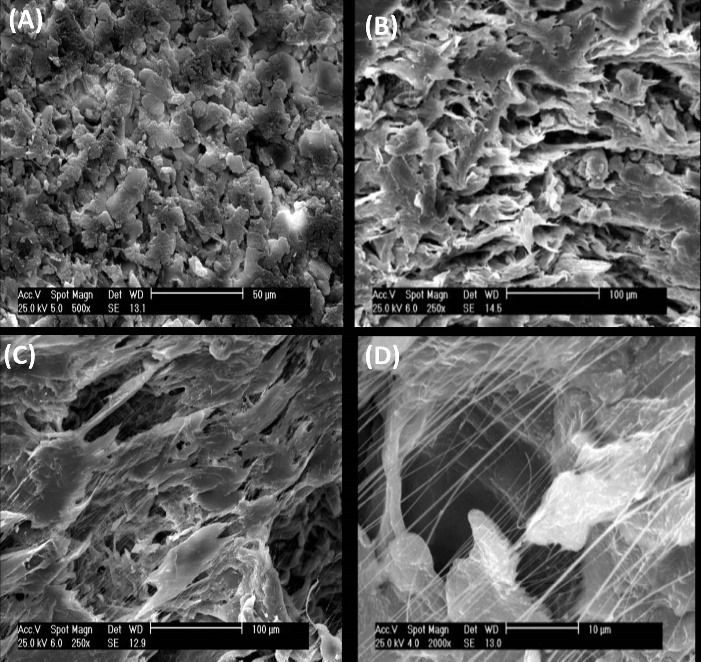
SEM analysis. Pore and nanofiber topography of PTFE/PVA (A, B, scale bare: 10, 20 μm) and PTFE/PVA/GO scaffolds (C, D, scale bar: 100, 10 μm).

SEM analysis. Pore and nanofiber topography of PTFE/PVA (A, B, scale bare: 10, 20 μm) and PTFE/PVA/GO scaffolds (C, D, scale bar: 100, 10 μm).